Crypto Market Breakout Imminent? Bullish Signals Abound
If we didn’t just have a brutal year long bear market, crypto charts would be looking very hopeful right now. Essentially all major charts are breaking out or primed for a breakout.
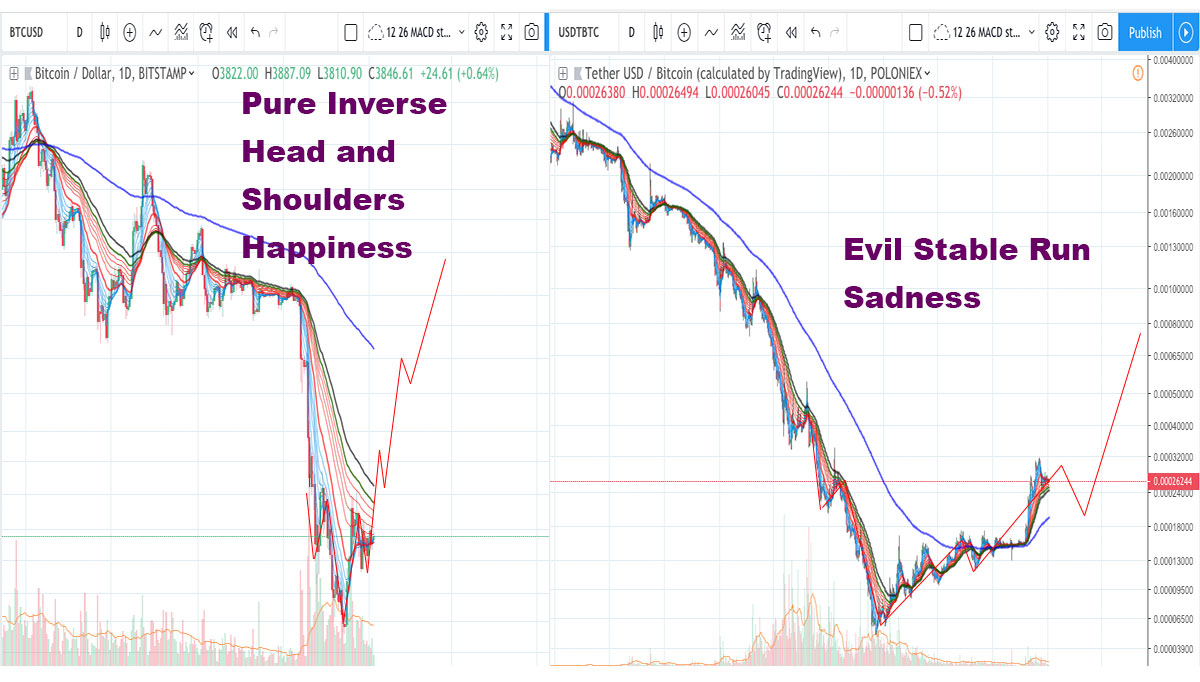
We have LTC, ETH, XRP, ADA, and TRX all showing real strength, we have BTC and the TOTAL cap painting a nice inverted head and shoulders (a bullish reversal pattern), and generally we have a solid week until the ETH fork (likely one of the factors in the all around bullishness).
The problem here isn’t crypto charts, it is 1. a knowledge of the 2018 bear market, and 2. the fact that USDT/BTC is also rather bullish (as you can see in the above chart)… i.e. the dollar is setup bullish against BTC and BTC setup bullish against the dollar at the same time (sort of an odd place to be in, but arguably the case).
The reality is, 2018 stable coins ran and crypto spent most of the year acting like a sad sack of rekt potatoes.
The reality is, TUSD/BTC and USDT/BTC (stable coin charts vs. BTC) don’t exactly look like they have capitulated yet.
Stables are still showing their moonish qualities, and the 2018 bear hasn’t shown signs of being dead yet, and thus we are dealing with a reality in which enthusiasm over bullish setups for cryptos should logically be curbed a little.
Sure you have rather cheap compared to 2017 and 2018 cryptos breaking out or about to break out across the board, this really beautiful setup with potentially cheap coins set to moon, it isn’t something anyone serious about crypto long term or short term should ignore…. but, you also have this specter of stables and bears haunting the charts.
Really odd place to be in…. but …. but … crypto is usually odd, so welcome to 2019 I guess.
That said, for anyone new to the space or for cash traders, those 2x runs on BCH, TRX, and ETH recently are nothing to scoff at! We may not be in the heights of 2017 mania, and we may have fallen a long way from all time highs, but a few of these runs have been pretty serious… so there is this glimmer of hope and this very real reason to be excited as a trader.
Bottomline: Both the above charts will likely play out in waves, and that means both could have their moment to shine (especially considering the timeframes where the more zoomed out usdt chart can account for the btc chart being bullishs short term)… but ultimately one chart has to win (as the charts are essentially inversions of each other).
-

Understanding Stock Price Fluctuations: A Beginner's Guide
When you look at stock price charts, you will undoubtedly notice that the prices of most stocks go up and down quite a bit. Many people that are just getting started in the market do not underst
-
Stock Market Returns: Understanding Potential Growth & Risks
One of the fundamental ideas I try to promote here at Get Rich Slowly is your savings ought to be invested for long-term growth. You ought to use the magic of compounding to create a wealth sno
Bitcoin
- Crypto & Real Estate: How Digital Assets Are Disrupting the Property Market
- Crypto Risk Management: Strategies for Market Downturns
- Bitcoin at $9k: Understanding the Bull vs. Bear Battle
- Bitcoin's Correction & Its Impact on Altcoins: A Market Analysis
- Unlock Investment Potential: Understanding the Primary Market
- New Crypto Bill: What Does It Mean for the Digital Asset Market?
- Bitcoin ETFs: A New Era for Cryptocurrency Investment?
- Best Cryptocurrency Research Tools for 2024 | Expert Reviews
- Meta Eases Crypto Ad Restrictions: Market Implications & Future Outlook
-
 Navigating Market Volatility: Top 5 Mutual Funds for Uncertain Times
Getty ImagesThe stock market has given investors a bad case of whiplash over the past few months. In December, the Standard & Poor’s 500-stock index tumbled 9%. Since then, however, the benchmark ...
-
 Stock Market Outlook After the Election: Predictions & Strategies
The election day is upon us at last. In swing states, it will be safe to turn your television on tomorrow. The barrage of ads will, at long last, come to an end. The stock market is going to be loo...