Natural Gas Storage Report: EIA Data & Analysis
What Is the Natural Gas Storage Indicator?
The Natural Gas Storage Indicator is the U.S. Energy Information Administration's (EIA) estimate of working natural gas volumes held in underground storage facilities at the national and regional levels. The EIA provides weekly estimates of working gas volumes held in underground storage facilities at the Lower 48 states and five regional levels. Changes in these gas inventories on a weekly basis primarily reflect net withdrawals or injections. The report is generally updated and available every Thursday at 10:30 am EST. Unexpected changes such as above-average withdrawals or injections can have an immediate impact on natural gas prices.
Understanding the Natural Gas Storage Indicator (EIA Report)
The Natural Gas Storage Indicator is a measure of working gas, which is the volume of gas in a reservoir that is above a specified base level and is the amount of gas that is available for sale to the marketplace. The EIA report shows gas inventories for the reporting week and previous week, as well as the net change, on a national basis and for East, West and Producing regions. It also provides inventories for a year ago and the five-year average for historical comparison.
The overall approach relies on weekly survey data from a sample of operators of underground storage facilities. These data are used to prepare regional and national estimates for all underground storage.
History of the Indicator
Weekly estimates of working gas in storage were first provided by the American Gas Association (AGA) in 1994, however, by 2001, the AGA decided that it would discontinue its survey due to resource considerations. The EIA stepped in to fill the information gap to the natural gas market and released its first estimates of underground U.S. natural gas storage for the week ending May 3, 2002.
The Indicator Goal
According to the EIA, the goal of the weekly storage data program is to provide weekly estimates of the level of working gas in underground storage for the United States and five regions. The total volume of natural gas in underground storage reservoirs is classified as either base gas or working gas. Underground storage facilities may be reservoirs in depleted oil and gas fields, aquifers, or salt caverns.
The Natural Gas Storage Indicator is a very important data source for natural gas traders. According to the EIA, upon release of the report, the natural gas market reacts to the derived net change in inventory levels from the prior week. This information on the nature of the net changes between weekly inventory data reports is helpful in informing trading decisions that often move natural gas prices 3 cents to 5 cents per million British thermal units (MMBtu) each week upon release.
-

Understanding Customer Type Indicator (CTI) Codes in Futures Trading
What Are Customer Type Indicator (CTI) Codes? Customer type indicator codes (CTI codes) are part of a system that identifies futures exchange transactions made by brokers for different clients
-
Depletion Accounting: Understanding Resource Cost Allocation
What is Depletion? Depletion is an accrual accounting technique used to allocate the cost of extracting natural resources such as timber, minerals, and oil from the earth. Li
Futures trading
- Natural Gas Liquids (NGL): Definition, Types & Applications
- Understanding Natural Gas Measurement: What is MCF?
- China's Leading Natural Gas Companies: A Comprehensive Overview
- Fracking & Natural Gas Prices: Understanding the Connection
- Understanding Natural Gas Equivalent (NGE) in Oil & Gas
- Natural Gas ETFs: Investing in Natural Gas Prices - [Year]
- Oil vs. Natural Gas Ratio: Understanding the Indicator
- Natural Gas: Understanding Its Role in Modern Energy
- Natural Gas ETFs: Investing in Energy - What You Need to Know
-
Natural Hedges: Mitigating Risk with Asset Correlation
What Is a Natural Hedge? A natural hedge is a management strategy that seeks to mitigate risk by investing in assets whose performances are inherently negatively correlated. For instance, a nat...
-
 Aroon Indicator: Trend Identification & Market Analysis | Investopedia
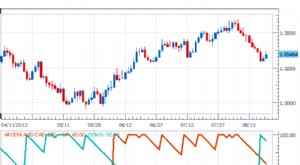
The Aroon indicator, developed by Tushar Chande in 1995, actually consists of two indicators that together are designed to:Identify trend changes or the beginning of a trendIdentify the existence of a...