Drunk Driving Statistics 2026: Facts, Risks & State-by-State Data
Every year, more than 12,000 people die in alcohol-impaired crashes. That is one person roughly every 42 minutes. Despite several public safety campaigns and preventative measures that have come into place over the past several decades, drunk driving is still a public safety issue. Fatalities caused by alcohol-impaired crashes accounted for 30% of all motor vehicle traffic fatalities.
In this report, the research team at FinanceBuzz analyzed national and state-level data on drunk driving fatalities and crash trends. We examine how risks vary by age, gender, and state, as well as laws, prevention efforts, and insurance implications. Our data is sourced from federal agencies, state legislatures, insurance organizations, and other nonprofits.
Smart Drivers, Smarter Savings.
Compare car insurance rates in Missouri
See if lower rates are available
Currently Insured?
Yes
No
By clicking the button above, I understand and agree that this site uses site visit recording technology (provided by Trusted Form, Jornaya, and Microsoft Clarity) Privacy Policy
Key insights on drunk driving
- Drunk driving is a major contributor to traffic deaths. In 2023, alcohol-impaired crashes killed more than 12,000 people and accounted for 30% of all motor vehicle fatalities, or roughly one death every 42 minutes.
- Fatalities surged during the pandemic and remain elevated. Drunk driving deaths jumped sharply in 2020 and 2021, peaking at 32% of all traffic fatalities. There was an 8.1% decline in 2023.
- Drunk driving risk varies widely by state. Montana reported the highest per-capita rate of drunk driving crashes in 2023 (8.5), while New York and Rhode Island had the lowest (1.0)
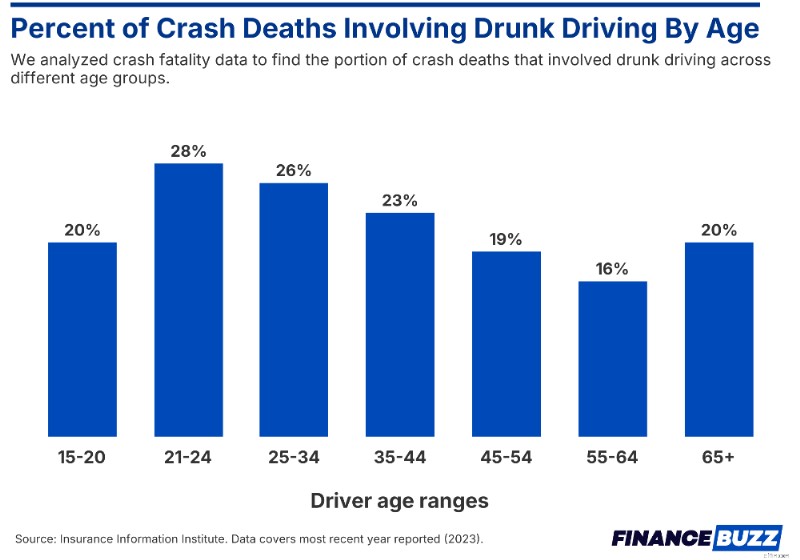
- Young adults remain the most affected, but older drivers are rising fastest. Drivers ages 21 to 24 accounted for the largest share of drunk drivers in fatal crashes in 2023 (28%), while older drivers, specifically those 65 and older, saw the biggest increase in involvement over the past decade (33%).
DUI laws and penalties
Blood alcohol concentration (BAC) limits
Blood alcohol concentration (BAC) is a measure of how much alcohol is in a person's blood. The higher the value, the more impaired the person is. In all but one state, it is illegal to drive with a BAC of 0.08%. In Utah, the limit is 0.05%. A 2022 study comparing Utah to other states found a 20% reduction in the alcohol-impaired car crash rate in The Beehive State, vs. just 6% in the rest of the U.S.
State laws and rules vary by driver type.
- All states have zero-tolerance BAC rules for drivers under 21.
- Commercial drivers are subject to a stricter BAC limit of 0.04%.
- Alcohol interlocks are mandatory for most drunk driving offenders, or for those with a BAC above 0.15% in some states.
Penalties
Penalties for driving while drunk include fines, jail time, and license suspension. How offenses are classified varies by state. In most states, the first DUI offense is generally treated as a misdemeanor, while repeat offenses may be charged as felonies in some states. For example, New York allows felony DUI charges after the second offense within a 10-year period, while Arizona allows the same on the third offense within seven years.
Alcohol-impaired driving trends over time
Over the past ten years, crash fatalities as a result of drunk driving have made up less than a third of all crash deaths, peaking at 32% in 2021 and 2022. The lowest rate in recent years happened in 2019, with 28% of all crashes being attributed to drunk driving. The total number of deaths hasn't fallen below 10,000 in a single year outside of 2014.
2020 and 2021 saw the largest increases in fatalities compared to the previous year (15% and 16% increases, respectively). This past one-year period (2022 to 2023) saw the highest decrease, falling by 8.1%.
Montana has the highest number of drunk driving crashes per capita (8.5 per 100,000 drivers), followed by South Carolina (6.3) and Tennessee (5.6). New York and Rhode Island tie for the fewest incidents per 100,000 drivers, both with 1.0.
Between 2022 and 2023, Oklahoma had the largest increase in incidents, going from 56 to 97 (70%), while Wyoming saw the largest decrease (48.6%). Both Washington and Wisconsin saw virtually no change (0.7%).
Drunk driving by age
In 2023, drivers aged 21 to 24 years old had the highest share of drunk drivers in fatal crashes (28%), followed by 25 to 34-year-olds. Since 2014, 25 to 34-year-olds have had the largest decrease in their share of drunk driving fatal crashes (10%), while drivers over 65 years old saw the largest increase (33%).
How does a DUI impact auto insurance?
- Premium increases: A DUI conviction will more often than not lead to higher insurance premiums because insurers see convicted drivers as high risk. Although it varies by state and insurer, convicted drivers typically see an increase of 30% or more. These insurance-related costs are often the largest and longest-lasting financial consequences of a DUI.
- High-risk driver status: After a DUI, any good-driver discounts are typically removed, and risk surcharges take their place. Drivers typically have these higher rates for 3 to 5 years, though rates vary by state and insurer.
- SR-22 or FR-44: Both of these are forms filed with the state to demonstrate the driver's financial responsibility for liability insurance after a DUI, reckless driving, or driving without insurance. However, the FR-44 is only required in Florida and Virginia for DUI convictions and requires higher liability limits than an SR-22. As a result, both increase insurance costs.
- Coverage limitations: Insurers may cancel or refuse coverage for a driver convicted of a DUI. This gives drivers limited options, which are often more expensive.
Ask the experts
Alongside the statistics above, we wanted to get expert insight about the additional impacts that drunk driving can have.
How do social determinants of health (income, education, and access to transportation) influence rates of drunk driving?

Drunk driving is one of the leading causes of accidents and deaths in the US. There are some clear correlates of drunk driving. For example, if someone does not own a car, they are significantly less likely to engage in drunk driving, even if they drink. Income has been shown to correlate with negative health behaviors in somewhat ambiguous ways.
On the one hand, lower income is associated with worse health behaviors and outcomes. On the other, it is a basic fact that paying for expensive "bads," such as cigarettes and alcohol, requires one to be making more than the bare minimum level of income. It is important to note that drunk driving is much more strongly affected by behavioral patterns and characteristics, such as impulsivity and high discount rates, than by socioeconomic status. Some of these behavioral traits are negatively correlated with income and education, and thus, it may appear in simple correlational studies that lower income and education are affecting the probability of drunk driving. However, the conclusion that lower income and education raise the probability of drunk driving would be incorrect. Frank Sloan, Lindsey Eldred, and Yangzhi Xu have a nice paper in the Journal of Health Economics that studies the behavioral economics of drunk driving.
How have DUI laws evolved? What was the turning point that led to current enforcement practices?

Beyond the legal consequences, driving impaired now comes with a steep personal cost, with the average DUI totaling around $10,000. Since MADD's inception, we have played a pivotal role in transforming how our country views and responds to impaired driving. Through persistent advocacy at all levels of government, MADD helped reframe impaired driving as the 100% preventable crime that it is.
Over the years, DUI laws have evolved significantly in response to pressure from victims, communities, and increasing data on the dangers of impaired driving. MADD's advocacy has resulted in crucial policy milestones such as raising the legal drinking age to 21, setting the national legal limit at .08 BAC, implementing sobriety checkpoints, and mandating ignition interlock devices for impaired driving offenders in more than 30 states.
MADD is committed to strengthening the future of sober driving through our ongoing support of the HALT Drunk Driving Law. Passed in 2021 as part of the federal infrastructure law, the HALT Law requires the U.S. Department of Transportation to establish a new safety standard for passive, advanced alcohol detection technology in all new vehicles. This piece of legislation aims to prevent a vehicle from operating if the driver is impaired by alcohol, without requiring any action from the driver. This game-changing technology will prevent more than 10,000 drunk driving deaths each year, according to the Insurance Institute for Highway Safety. MADD is working diligently with auto industry partners, the federal government, and lawmakers to ensure its implementation.
How does drunk driving contribute to the overall burden on the healthcare system?
According to the National Highway Traffic Safety Administration, 34 people die each day in the US in drunk driving-related accidents. Deaths are an extreme outcome, and many more individuals are injured in driving accidents. Such injuries often require a high-level trauma center and long-term recuperation and physical therapy periods.
The burden on the health care system, both in terms of patient complexity and financial costs, is high. It is very important to note that road design and system-build safety standards are equally important for reducing driving-related deaths and injuries. An excellent example comes from Sweden, where the Vision Zero initiative has drastically reduced traffic-related deaths and injuries.
My point here is that individual responsibility is certainly important, but we are able to reduce the burden of injuries and deaths through system designs and other measures that are determined by policy, not individual behaviors.
Drunk driving prevention, safety, and community programs
Drunk driving is preventable. Here are some options for keeping roads safer for everyone.
- Alternatives to driving after drinking
- Public transportation, rideshare services, and choosing a designated driver are ways for people to avoid driving after drinking. In 2021, a JAMA surgery study found that ridesharing services were associated with lower rates of motor vehicle crash-related injuries.
- Alcohol ignition interlocks
- Several states require drunk driving offenders to install alcohol ignition interlocks before driving. Thirteen states mandate this for first offenses.
- Community prevention programs
- This includes screening, intervention, and referral to treat people who drink excessive amounts of alcohol, as well as strategies to make public transportation easier to access and alcohol itself less financially attainable.
- Finally, other prevention methods include sobriety checkpoints, which occur when law enforcement officers stop vehicles to screen for alcohol-impaired drivers. Thirty-eight states include sobriety checkpoints in their strategy to combat impaired driving.
FAQs
How many people die in drunk driving traffic accidents?
According to the NHTSA, 12,429 people were killed in alcohol-impaired traffic accidents in 2023. This works out to one person every 42 minutes or 34 people per day.
What is considered drunk driving?
Drunk driving is defined as operating a vehicle with a blood alcohol concentration (BAC) of 0.08% or higher, except in Utah, where the limit is 0.05%.
Which states have the highest drunk driving crash rates?
In 2023, Montana had the highest rate for drunk driving crashes per 100,000 licensed drivers, with 8.5. South Carolina followed with 6.3 crashes, while Tennessee had 5.6.
Which states have the lowest drunk driving crash rates?
New York and Rhode Island tie for the lowest rates with 1.0 each.
Which age group is most likely to be involved in drunk driving fatal crashes?
Drivers aged 21 to 24 had the highest share of drunk driving fatal crashes in 2023. Meanwhile, drivers aged 65 and older have seen the largest increase in fatal drunk driving crashes since 2014 (33%).
How does a DUI affect car insurance costs?
A DUI typically leads to more expensive insurance premiums. Convicted drivers often see increases of over 30%. Higher insurance costs also stem from required state filings, such as SR-22 and FR-44 forms, as well as from more limited coverage options.
What strategies help reduce drunk driving?
There are several prevention methods, such as ride-sharing, public transportation, and designated drivers. There are also reactive measures such as alcohol ignition interlocks and sobriety checkpoints.
Sources
NHTSA, "Drunk Driving." Accessed on December 17, 2025.
NHTSA, "Traffic Safety Facts: Alcohol-Impaired Driving." Accessed on December 17, 2025.
Insurance Information Institute, "Facts + Statistics: Alcohol-impaired driving." Accessed on December 19, 2025.
Insurance Institute for Highway Safety, Highway Loss Data Institute, "Alcohol and drugs". Accessed on December 19, 2025.
Federal Motor Carrier Safety Administration, "Is a driver disqualified for driving a CMV while off-duty with a blood alcohol concentration over 0.04 percent?" Accessed on December 19, 2025.
Insurance Institute for Highway Safety, Highway Loss Data Institute, "Teenagers." Accessed between December 17 and 22, 2025.
NCSL, "Criminal Status of State Drunken Driving Laws." Accessed on December 19, 2025.
NHTSA, "Fatality Analysis Reporting System (FARS)." Accessed on December 17, 2025.
Progressive, "Auto insurance after a DUI." Accessed on December 22, 2025.
Allstate, "How a DUI affects your car insurance." Accessed on December 22, 2025.
U.S. News, "How Does a DUI Affect Car Insurance Costs?" Accessed on December 22, 2025.
Yahoo! Finance, "Here's how a DUI impacts your car insurance." Accessed on December 22, 2025.
JAMA Surgery, "Association of Rideshare Use With Alcohol-Associated Motor Vehicle Crash Trauma." Accessed on December 19, 2025.
Insurance Institute for Highway Safety, Highway Loss Data Institute, "Alcohol interlock laws." Accessed on December 19, 2025.
CDC, "Preventing Impaired Driving." Accessed on December 22, 2025.
NHTSA, "Publicized Sobriety Checkpoints." Accessed on December 22, 2025.
Save On Your Auto Insurance

- You could save up to $600 with some companies.
- Compare dozens of providers in under 5 minutes.
- Fast, free, and easy way to shop for insurance.
- Quickly find the perfect rate for you.
Related Articles
-

Auto Loans for Unemployed Individuals: Options & Strategies
When you apply for auto loans, potential lenders want to see proof of income to verify your ability to make the monthly payments. While being unemployed will make the process more arduous, there are s
-

Managing Your Gaming Expenses: A Practical Budgeting Guide
Great -- your local store just got that game youve been waiting to play. Good thing you put some money aside to buy it. Video gaming is big business. Its estimated that it cost $40 to $100 mil
insurance
- Blue Cross Blue Shield Reaches $2.7B Antitrust Settlement Agreement
- Humana Announces 800+ Job Cuts Amid Workforce Reduction
- War Risk Insurance: Protecting Your Business from Unforeseen Threats
- Marine Insurance Brokers: Protecting Your Vessels & Cargo
- Save Money: The Benefits of Bundling Your Insurance
- Life Insurance vs. Annuities: Choosing the Right Financial Protection
- Ski Holiday Insurance: Avoid Policy Invalidations & Stay Covered
- Professional Liability Insurance: Protecting Your Expertise
- Liability Insurance: Understanding Costs & Protecting Your Assets
-
 Android Privacy Concerns: Are Your Phone's Settings Enough?
Image Credit: @Kalala/Twenty20 It's not hard to get down on the iPhone, especially when Apple makes it so easy. From the eye-popping cost of a new device to the weird redesigns and the batter...
-
 Shorting the Dollar: 2 Simple Strategies to Profit from a Weakening US Currency
As a (semi)free-floating currency, the dollar can go down any minute. Do you think the dollar is going down? Do you want to profit in case it does? This article gives the average person 2 dif...