Inverted Hammer Candlestick Pattern: A Trader's Guide
The world of online trading does not prove profitable for anyone unless you have a good strategy at hand. This is the primary reason many newbies do not make a place for themselves in the market. They only take a look at established traders and their profit and think it will be easy to make money.
Trading is same as any other business. It takes time, patience and strategical approach to make some profit and today we will be looking at a proven method that is widely used by a lot of traders to plan their trading sessions and determine whether the prices will go higher or lower.
The method is called Inverted Hammer Candlestick Method. This method is used when one sees an inverted hammer candlestick pattern which can indicate that there is going to be a reversal in prices. This pattern occurs when there is a massive pressure from buyers to raise the price of a specific asset after there has been a long downtrend. When this pattern does occur, it indicates the possibility of a bullish price reversal.
Identifying the Inverted Hammer Candlestick
This pattern gets its name from the shape it makes. It is in a shape of an inverted hammer, but that is not the only thing which determines the existence of said pattern.
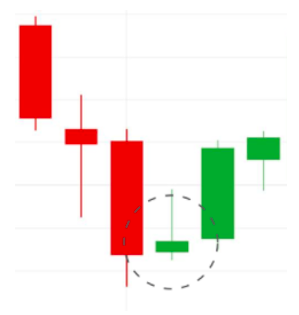
To identify the inverted hammer candle, look for the upside-down hammer shape where the upper wick is longer than the lower shorter body. This shape also means that the open, close and low prices are almost the same. There can be a green inverted hammer or a red one depending upon the circumstances. When the low and open prices are the same, a green inverted hammer is formed and when low and close prices are almost the same, a red inverted hammer is formed.
Inverted hammer pattern after a downtrend means that bulls are testing the strength the bears are actually winning as they pushed the prices back up at the point where they were in the morning. So the pattern is mostly bullish as the prices are being pushed higher.
What is the Inverted Hammer telling you?
Now we know how to identify the inverted hammer pattern and why does it occur but the real question is what does it tell you? In simple words, it means that a potential reversal in prices is coming the next day.
Let me explain. The pattern starts at a downtrend but there is a constant pressure from the bulls to get the price higher during the day, until the pressure ends at the end of the day and the prices are a little lower or almost at the same price as the open price.
The next day will confirm the reversal when the day opens with an uptrend occurs. This upward rend will continue and will result in a bullish (green) candlestick.
Most of the traders see this trend and take it as an indicator to go long.
-

GoodRx: Understand Prescription Drug Prices & Save Money
Pharmaceutical companies have a complicated pricing system for prescription drugs. Prices are not consistent across the country and even vary among pharmacies in the same town. Until GoodRx was formed
-

Understanding Short-Term Disability: Income Protection & Eligibility
Short-term disability benefits protect your income if you're unable to work for a specific amount of time, but expect to be able to resume your job in the future. Once you've proven that your
Personal finance
- Direct Deposit Explained: A Comprehensive Guide for Employees & Employers
- Understanding Flex Pay: Buy Now, Pay Later Explained
- Understanding EBT Cards: A Guide to SNAP Benefits
- Understanding Credit Repair: How to Improve Your FICO Score
- Trading Leverage: A Comprehensive Guide to Risks & Benefits
- Rule of 72: Calculate Investment Growth & Doubling Time
- Experian Boost: How It Works & Builds Your Credit
- Understanding Pet Insurance: A Comprehensive Guide for Pet Owners
- Money Orders: A Comprehensive Guide to Usage and Functionality
-
 AutoTrader.com: Understanding How the Platform Works
As the website prominently notes, AutoTrader.com "is an online vehicle listing service that connects car buyers with sellers." Sellers can list details about the vehicle, their contact infor...
-
 Understanding Car Loans: A Comprehensive Guide
A set of wheels can mean independence, easy mobility and personal freedom. But with the good things also comes the obligation to pay for the vehicle, and unless you have enough cash available you'...