Bitcoin Bull Run 2015-2017 vs. 2019: Fibonacci Retracement Analysis
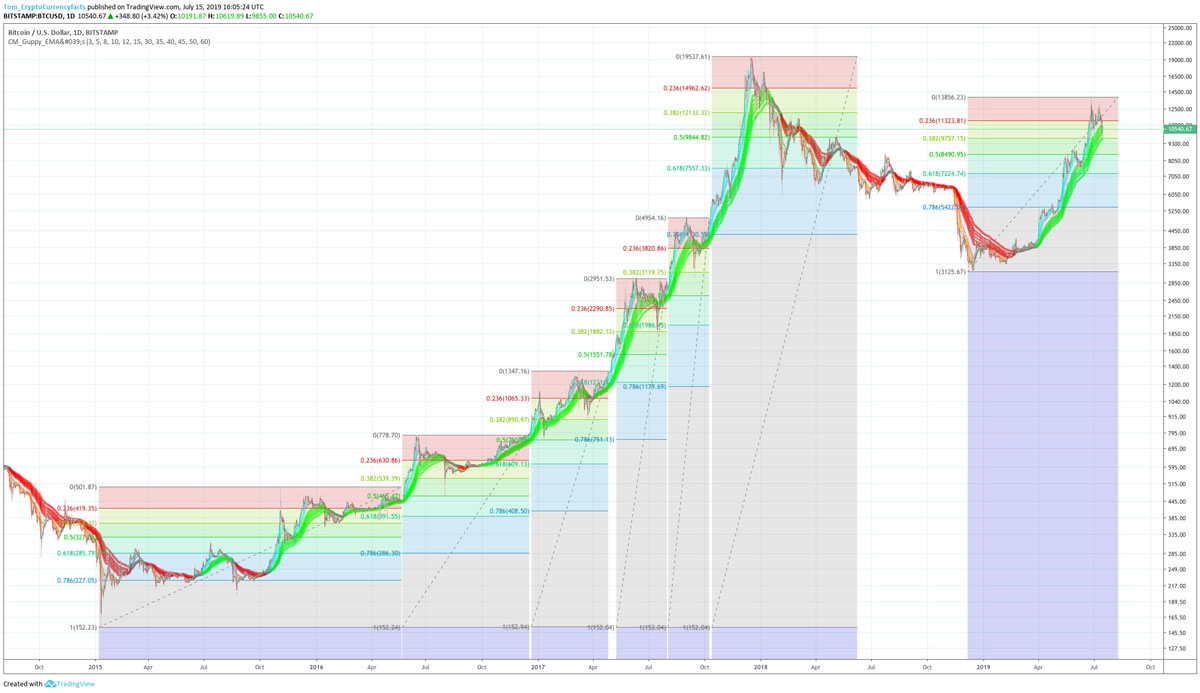
Drops of about 38% were common in the Bitcoin bun run of 2015 – 2017. In other words, Bitcoin commonly retraced to the .382 fib level. Could the same happen in 2019?
Measuring from the low of 2018 to the top so far of 2019, as seen in the chart above, we can see the .382 has so far acted as support.
Looking at the chart below, which illustrates the fib levels of more moves, we can see one wick down to the .5 (a 50% retracement).
Looking then at the chart above we can see that once in a while we did also get a retracement to the point 5, for example a quick wick down in August 2016.
In short, it is common to see retracements to the .382 (about a 38% correction), and every so often also a quick wick down to the .5 (about a 50%) retracement, in Bitcoin bull markets.
Thus, so far, we still have a price structure that could be seen as being part of a new bull market based on historical price trends.
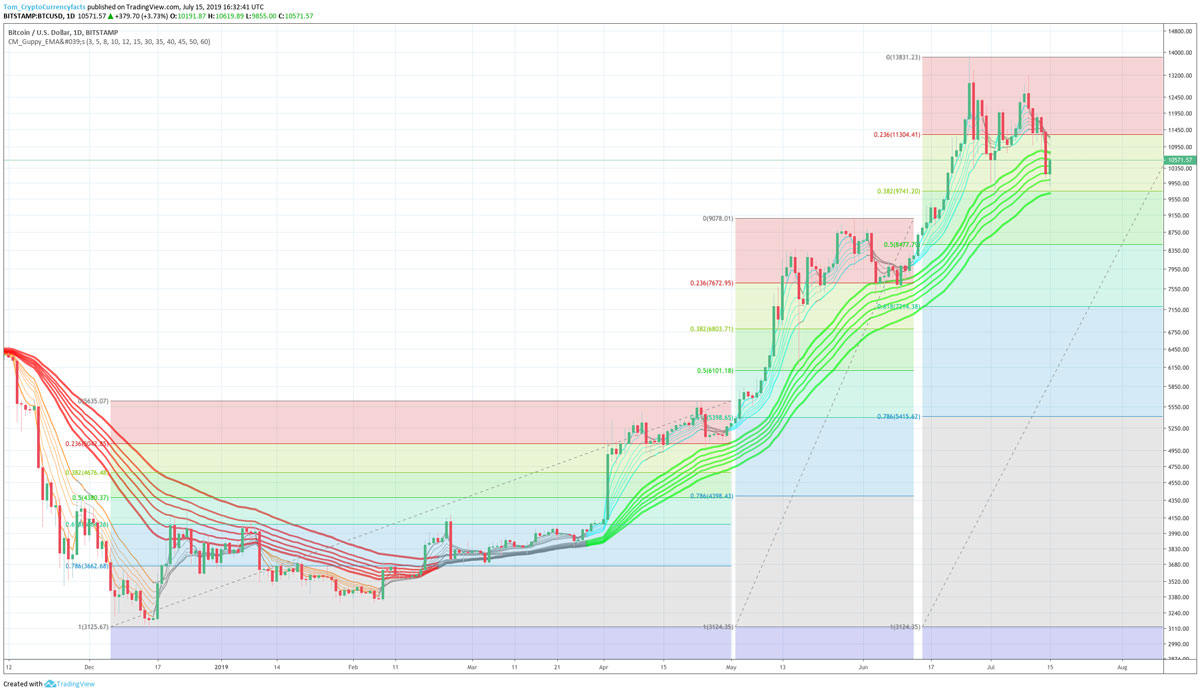
Bitcoin Fibonacci retracements for 2019 by fib level.
-

Bitcoin Explained: A Comprehensive Guide to Cryptocurrency
The present age is the age of smartphones and digitization. Every family in the world holds at least one smartphone and is involved in the digital procedures involved directly or indirectly. The aut
-

Understanding the Bitcoin Blockchain: What It Records & How It Works
The Bitcoin blockchain is essentially an enormous, shared, encrypted list of all addresses that hold Bitcoin balances. Because this list is shared, it is referred to as a digital distributed le
Bitcoin
- Understanding Bull Runs: What They Are and What Drives Them
- Bitcoin Price History: 2010-2019 Analysis & Visual Chart
- Bitcoin July 2018: Analyzing Bull & Bear Scenarios - Technical Analysis
- Bitcoin Mining Costs: A Comprehensive Breakdown (2024)
- Bitcoin & the Dot-Com Bubble: A High-Speed Comparison?
- Bitcoin Value: Exploring Minimal Value & Investment Risks
- Bitcoin vs. Bitcoin Cash: A Comprehensive Comparison
- Understanding Bitcoin Price: Factors Influencing Value
- El Salvador's Bitcoin Legalization: Global Implications & Lessons
-
 ASX & Blockchain: A Look Back at 2017 and Future Prospects
What a difference a year makes. In January 2016, ASX was bathing in the warm glow of having been acclaimed by Blythe Masters, an American super saleswom...
-
Understanding Money: Exploring the Evolution of Currency and Cryptocurrencies
When you begin to delve into the question of what money really is, you must be prepared for some metaphysics. Money, currencies and other such media of exchange...