Presidents and the Stock Market: A Performance Analysis
Evan El-Amin/Shutterstock.com
President Harry Truman famously had a sign on his desk that read “The Buck Stops Here.”
If that’s the case when it comes to the stock market, it’s fair to wonder how well your portfolio will do under President Donald Trump.
But which presidents brought out the bulls, and which ones fed the bears, might surprise you.
For example, few people would probably cite Calvin “Silent Cal” Coolidge as their favorite president, but Coolidge presided over a 209 percent run-up in stock prices, the largest of any president after 1900, according to S&P 500 composite data gathered by Yale economist Robert Shiller. (Of course, the fact that the stock market crash that touched off the Great Depression occurred the same year he left office takes a little bit of the luster off that achievement).
Look at the graphic here to see how well Trump will have to do to keep up with his predecessor, President Barack Obama, and how other presidents since 1900 stack up.
 Coolidge, 1923
208.52%
1.22%
Coolidge, 1923
208.52%
1.22%
 Clinton, 1993
202.38%
1.03%
Clinton, 1993
202.38%
1.03%
 Obama, 2009
166.14%
1%
Obama, 2009
166.14%
1%
 Ford, 1974
36.53%
0.93%
Ford, 1974
36.53%
0.93%
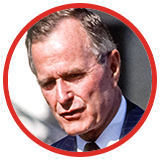 H.W. Bush
1989
48.04%
0.91%
H.W. Bush
1989
48.04%
0.91%
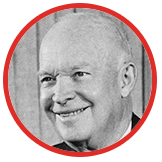 Eisenhower, 1953
130.94%
0.87%
Eisenhower, 1953
130.94%
0.87%
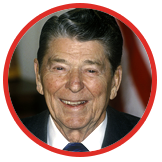 Reagan, 1981
122.27%
0.73%
Reagan, 1981
122.27%
0.73%
 Truman, 1945
83.33%
0.71%
Truman, 1945
83.33%
0.71%
 F.D. Roosevelt, 1933
123.6%
0.64%
F.D. Roosevelt, 1933
123.6%
0.64%
 Kennedy, 1961
16.81%
0.58%
Kennedy, 1961
16.81%
0.58%
 Johnson, 1963
37.52%
0.57%
Johnson, 1963
37.52%
0.57%
 Carter, 1977
31.68%
0.52%
Carter, 1977
31.68%
0.52%
 Harding, 1921
17.15%
0.17%
Harding, 1921
17.15%
0.17%
 T. Roosevelt, 1901
10%
0.07%
T. Roosevelt, 1901
10%
0.07%
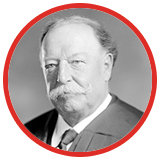 Taft, 1909
0.56%
-0.19%
Taft, 1909
0.56%
-0.19%
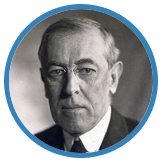 Wilson, 1913
-19.77%
-0.31%
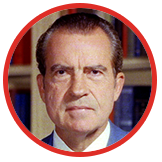
Nixon, 1969
-21.86%
-0.36%
Wilson, 1913
-19.77%
-0.31%
Nixon, 1969
-21.86%
-0.36%
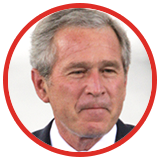 W. Bush, 2001
-33.71%
-2.23%
W. Bush, 2001
-33.71%
-2.23%
 Hoover, 1929
-75.42%
Hoover, 1929
-75.42%
Source: S&P Composite Stock Price Index compiled by Robert Shiller.
Image credits: H. W. Bush: Rob Crandall/Shutterstock.com; W. Bush: Northfoto/Shutterstock.com; Carter: Nir Levy/Shutterstock.com; Clinton: Everett Collection/Shutterstock.com; Coolidge: Everett Historical/Shutterstock.com; Eisenhower: Moore/Getty Images; Harding: Everett Historical/Shutterstock.com; Hoover: Harris & Ewing/Library of Congress; Johnson: Agence France Presse/Getty Images; Kennedy: Bachrach/Getty Images; Obama: Evan El-Amin/Shutterstock.com; Nixon: Bachrach/Getty Images; Reagan: Joseph Sohm/Shutterstock.com; F. D. Roosevelt: UniversalImagesGroup/Shutterstock.com; T. Roosevelt: Everett Historical/Shutterstock.com; Taft: Everett Historical/Shutterstock.com; Truman: PhotoQuest/Getty Images; Wilson: Everett Historical/Shutterstock.com
Methodology: Average monthly return and stock market price change were calculated using S&P 500 composite data gathered by Yale economist Robert Shiller. Presidents who served their full term since 1900 were considered, and presidents were given "credit" for months in which they served the majority of days as president.
- The 5 presidential election years when the stock market gained the most
- 5 pros and cons of investing in annuities
- Why are bond yields flying high?
- Bond yields to edge higher
- Top 2017 investing tips
- Building liquid savings
-

COVID-19 & the Stock Market: Q1 2020 Impact & Recovery
In Q1 of 2020, the novel coronavirus, aka COVID-19, began to spread rapidly around the world. Due to social distancing requirements and widespread shutdowns of businesses, a bear market and recession
-
Investing Strategies: Building Wealth Beyond Individual Stocks
What's the best way to start investing and get rich investing in individual stocks? All you have to do is travel back in time to 1980 and buy a bunch of shares of Apple. Not bad, right?The truth
invest
- Understanding the Stock Market: Key Characteristics & Exchanges
- The Presidential Cycle: Understanding Market Trends After Elections
- Understanding the Stock Market: A Beginner's Guide
- Top 3 Stock Simulators for Practice & Learning
- Top Total Stock Market Index Funds: Diversify & Grow
- Investing in Stocks: A Beginner's Guide to Building Wealth
- Understanding the Stock Market: A Beginner's Guide
- Presidential Influence on the Stock Market: Separating Fact from Fiction
- Top 20 Stock Market Resources: Podcasts & Books for Investors
-
Understanding Stock Price Fluctuations: A Beginner's Guide
When you look at stock price charts, you will undoubtedly notice that the prices of most stocks go up and down quite a bit. Many people that are just getting started in the market do not underst...
-
Strategic Investing: A Guide to Navigating the Stock Market
Determining the best way to invest money in the stock market requires using a multi-step process to decide what to buy, how to do so and when to sell. The market can be subject to major ups and d...