Aggressive Investment Strategies: Risk, Reward & Suitability
An aggressive investment strategy is a high-risk, high-reward approach to investing. Such a kind of strategy is appropriate for younger investors or those with higher risk toleranceRisk ToleranceRisk tolerance refers to the amount of loss an investor is prepared to handle while making an investment decision. Several factors determine the level of. The focus of aggressive investing is capital appreciation instead of capital preservation or generating regular cash flows.

A standard example of an aggressive strategy compared to a conservative strategy would be the 80/20 portfolio compared to a 60/40 portfolio. An 80/20 portfolio allocates 80% of the wealth to equities and 20% to bonds compared to a 60/40 portfolio, which allocates 60% and 40%, respectively.
The following sections discuss five methods that can be used to implement an aggressive strategy and present a quantitative analysis of the performance of aggressive and conservative strategies through time.
Aggressive Investment Methods
There are many ways to pursue an aggressive investment strategy. Below are five strategies that can be utilized by most investors based on their income and sophistication.
1. Small-Cap Stocks
Small-cap stocks provide the potential of very high capital appreciation. The prices can compound to more than two times the original price if the business becomes successful and achieves strong revenue growth and profitability.
The risk with small-cap stocks is that one can lose their entire investment if the business fails. Sometimes a business can be outright fraudulent, which is common in small-cap stocks because there is not enough due diligenceDue DiligenceDue diligence is a process of verification, investigation, or audit of a potential deal or investment opportunity to confirm all relevant facts and financial information, and to verify anything else that was brought up during an M&A deal or investment process. Due diligence is completed before a deal closes. on smaller companies. Hence, it is important to rigorously research the companies before investing.
2. Emerging Markets Investing
Emerging markets are growing economies primarily located in Asia and parts of Eastern Europe. The countries has a high potential for economic growth, growing rapidly over the past few decades. Investments in emerging markets can rapidly compound as the economy grows and is one of the most robust ways to grow an investment.
On the other hand, emerging markets usually lack high-quality institutions and governance found in developed markets. Thus, regulatory and political risks are more salient in emerging markets. Moreover, there might be frictions to investing in emerging markets like regulatory hurdles or currency issues.
3. High-Yield Bonds
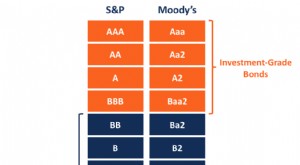
High-yield bonds are a popular source of yield for investors looking for higher returns while generating regular cash flows. The bonds are typically high coupon bonds with below-investment-grade credit ratings – also known as speculative grade or junk bondsJunk BondsJunk Bonds, also known as high-yield bonds, are bonds that are rated below investment grade by the big three rating agencies (see image below). Junk bonds carry a higher risk of default than other bonds, but they pay higher returns to make them attractive to investors..
The risks with high yield bonds are like small-cap stocks. Hence, the issuing companies should be well researched to ensure there are no liquidity and solvency issues.
4. Options Trading
Options can be used to hedge against or speculate on movement in security prices. They are non-linear securities and can provide a constant source of income in times of low volatility or generate massive payoffs during large market moves.
A common strategy to sell options to collect a premium. If the market is not very volatile, such a strategy can provide a high return, but an investor can lose more than what they’ve made over time on a single market move that goes against the investor’s position.
5. Private Investments
Private investments are more suitable for investors with higher net worth. There are many avenues in private markets, such as angel investing, where a single investment can range from $10,000 to $50,000 in a single business.
If successful, the business can compound rapidly, returning a high multiple of the initial investment. There are opportunities like venture capital, private equity, and debt that require much higher capital commitment.
Quantitative Analysis
Quantitative analysis involves collecting and assessing measurable and verifiable data to understand the behavior and performance of companies. It helps decision-makers make informed decisions, particularly with the assistance of data technology methods.
Data & Methodology
The data used for this quantitative analysis example is from the Fama-French database on factor returns. The dataset of monthly returns starting in 1926 divides the universe of companies into deciles based on size or market capitalizationMarket CapitalizationMarket Capitalization (Market Cap) is the most recent market value of a company’s outstanding shares. Market Cap is equal to the current share price multiplied by the number of shares outstanding. The investing community often uses the market capitalization value to rank companies. For the purpose of the analysis, the lowest decile – i.e., the smallest companies – represents an aggressive investment strategy, while the top decile represents a conservative strategy.
The analysis presents the performance of both strategies across various metrics like the cumulative return, drawdown, and the Sharpe ratio. The analysis illustrates the risk-reward profile of the two strategies.
Analysis
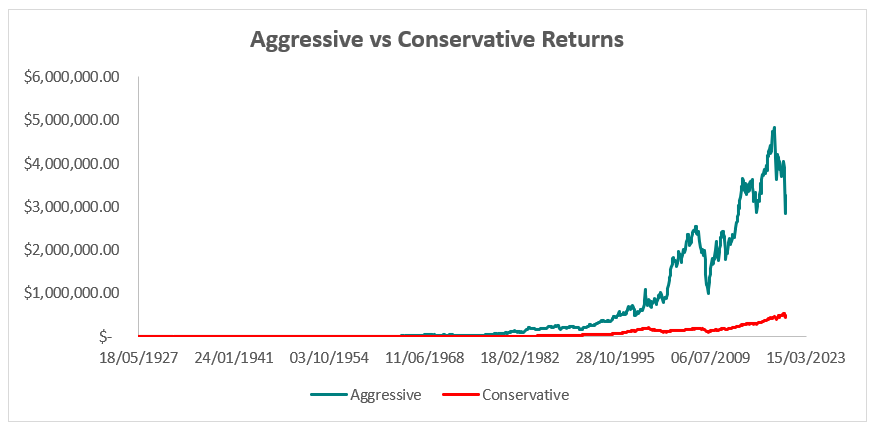
Cumulative Return: The cumulative return of a strategy is the value of a single dollar passively invested in the strategy over time. The chart below shows the return on both aggressive and conservative strategies over the data. It is clear from the chart below that an aggressive strategy’s vastly overperformed the conservative strategy.
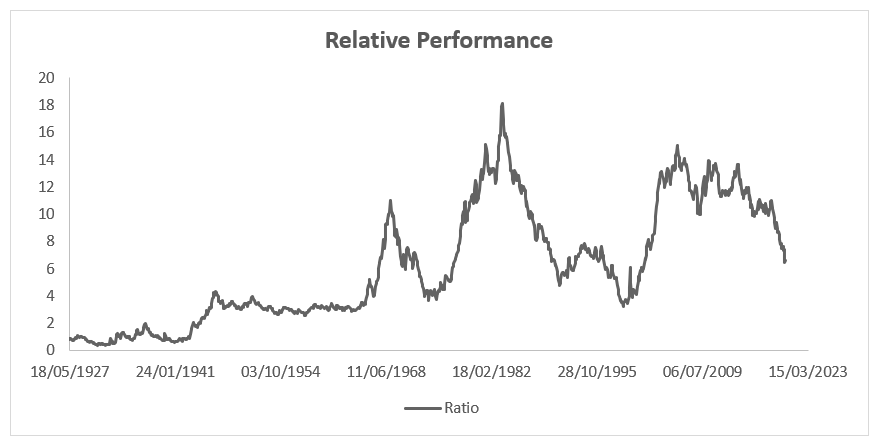
The second chart plots the ratio of performance of aggressive and conservative strategies given by dividing the value of an aggressive portfolio by the value of a conservative portfolio.
Drawdown: The drawdown of a strategy measures the decline in the value of a portfolio from peak to trough. The chart below plots the drawdown of both strategies. Clearly, the aggressive strategy sess much higher drawdowns than the conservative strategy. Therefore, there is a higher risk of ruin or losing all the capital in an aggressive strategy.
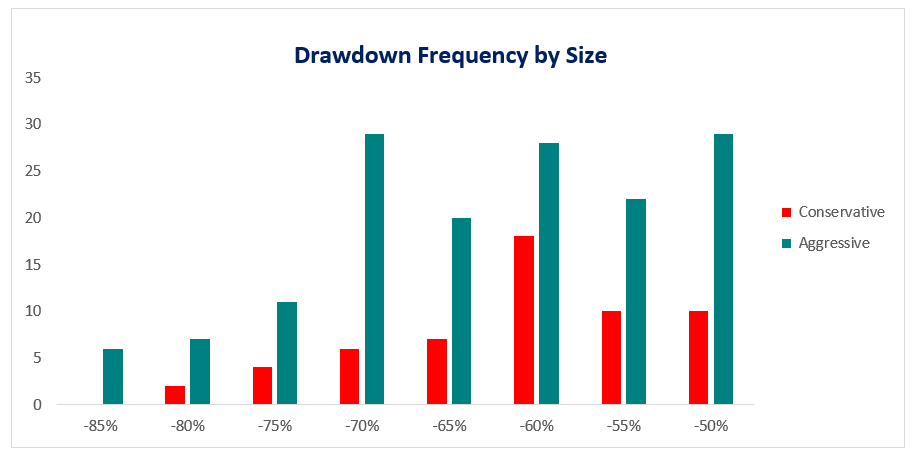
To further explore the drawdowns, we plot the histogram of large drawdowns (greater than 50%). The histograms show that the frequency of deeper drawdowns is much higher for the aggressive strategy. According to the data, the median drawdown for the conservative strategy was about -5.08%, while for the aggressive strategy, it was -10.8%.
Portfolio Metrics: The portfolio metrics used to analyze the two strategies are the alpha and the Sharpe RatioSharpe RatioThe Sharpe Ratio is a measure of risk-adjusted return, which compares an investment's excess return to its standard deviation of returns. The Sharpe Ratio is commonly used to gauge the performance of an investment by adjusting for its risk.. The alpha measures the idiosyncratic over or underperformance of a strategy relative to a benchmark. The Sharpe ratio measures the risk-adjusted performance of a strategy as measured by the ratio of excess returns over the volatility of return.
Over a 30-year horizon starting in 1990, data shows the pattern that an aggressive strategy can massively over-perform or underperform the benchmark in certain periods. On the other hand, the conservative strategy shows an alpha that remains in a small range.
The Sharpe ratio of an aggressive strategy is consistently below that of a conservative strategy, given that an aggressive strategy is riskier with very volatile returns. The average Sharpe ratio over the analysis of the period is 0.85 for the aggressive strategy, whereas the conservative strategy showed an average Sharpe ratio of 1.25.
Additional Resources
CFI offers the Capital Markets & Securities Analyst (CMSA)®Program Page - CBCAGet CFI's CBCA™ certification and become a Commercial Banking & Credit Analyst. Enroll and advance your career with our certification programs and courses. certification program for those looking to take their careers to the next level. To keep learning and advancing your career, the following resources will be helpful:
- High Net Worth individual (HNWI)High Net Worth Individual (HNWI)A high net worth individual (HNWI) refers to an individual with a net worth of a minimum of $1,000,000 in highly liquid assets, such as cash and cash
- MSCI Emerging Markets IndexMSCI Emerging Markets IndexThe MSCI Emerging Market Index is used to measure the stock market performance within emerging countries. It is one of many indexes that have
- Options: Calls and PutsOptions: Calls and PutsAn option is a derivative contract that gives the holder the right, but not the obligation, to buy or sell an asset by a certain date at a specified price.
- Investing: A Beginner’s GuideInvesting: A Beginner's GuideCFI's Investing for Beginners guide will teach you the basics of investing and how to get started. Learn about different strategies and techniques for trading
-
High-Yield Bonds: Understanding Risk & Potential Returns
A high-yield bond is a bond that carries a relatively higher interest rate as a result of its lower credit rating, compared to investment-grade bonds. It is a corporate bond with a credit rating below
-

Income Investing: Generate Passive Income with Stocks & Bonds
Income investing is an investment strategy that is centered on building an investment portfolio specifically structured to generate regular income. The sole objective of the income investing strategy
invest
- Understanding Investments: A Beginner's Guide to Growth & Income
- Understanding Drawdowns: A Key Investment Risk
- Understanding Investment Horizon: A Comprehensive Guide
- Trading Strategies: A Comprehensive Guide to Profitable Investing
- Investment Trusts Explained: A Comprehensive Guide
- Dogs of the Dow: A Simple & Potentially Profitable Investment Strategy
- Bonds vs. Stocks: A Comprehensive Guide for Investors
- Hedging Explained: Protect Your Investments from Risk
- Understanding Bonds: A Comprehensive Guide for Investors
-
 Understanding Fallen Angels: Bond Downgrades Explained
A fallen angel is a bond that was rated investment-grade but has since been downgraded to junk status due to the declining financial position of its issuer. The bond is downgraded by one or more of th...
-
![Green Bonds: Financing a Sustainable Future | [Your Company Name]](https://www.etffin.com/article/uploadfiles/202110/2021100815235065_S.jpeg) Green Bonds: Financing a Sustainable Future | [Your Company Name]
Green Bonds: Financing a Sustainable Future | [Your Company Name]A green bond is a debt security issued by an organization for the purpose of financing or refinancing projects that contribute positively to the environment and/or climate. A green bond is alternative...