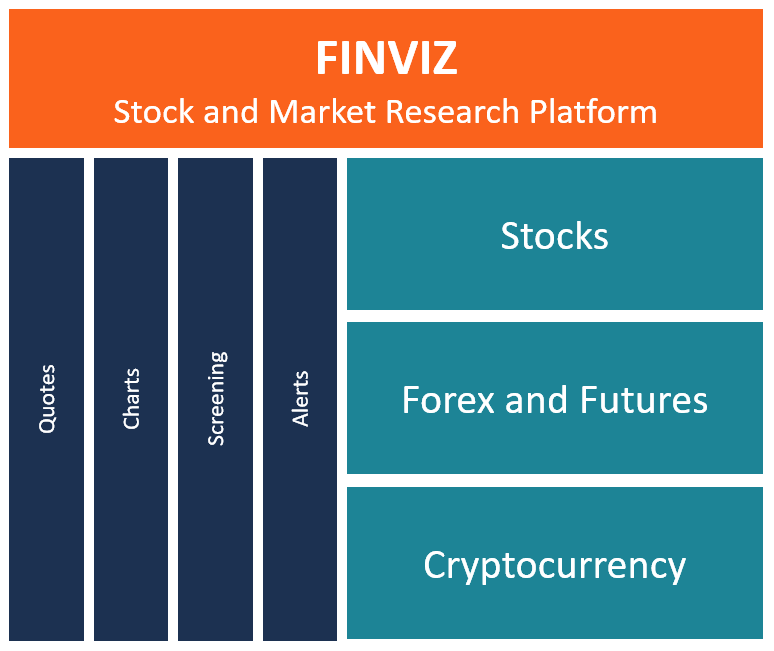
FINVIZ: Your Free Stock Market Data & Trading Research Platform
FINVIZ is a browser-based stock marketStock MarketThe stock market refers to public markets that exist for issuing, buying and selling stocks that trade on a stock exchange or over-the-counter. Stocks, also known as equities, represent fractional ownership in a company research platform that makes market information easily accessible to traders and investors. The platform offers free and premium tools that traders can use to generate ideas and find opportunities for trading stocksStockWhat is a stock? An individual who owns stock in a company is called a shareholder and is eligible to claim part of the company’s residual assets and earnings (should the company ever be dissolved). The terms "stock", "shares", and "equity" are used interchangeably., forex,Forex Trading - How to Trade the Forex MarketForex trading allows users to capitalize on appreciation and depreciation of different currencies. Forex trading involves buying and selling currency pairs based on each currency's relative value to the other currency that makes up the pair. and futuresFutures ContractA futures contract is an agreement to buy or sell an underlying asset at a later date for a predetermined price. It’s also known as a derivative because future contracts derive their value from an underlying asset. Investors may purchase the right to buy or sell the underlying asset at a later date for a predetermined price.. Visitors on the website get access to the latest financial news, market maps, comparative tools and charts, portfolio tracking, advanced screeners, and sector performance tools.
While all the information displayed on the FINVIZ homepage can be overwhelming for first-time users, knowing how to use the charts and free tools can save traders both time and money that would’ve been spent on multiple tools.
FINVIZ Pricing Options
There are three main FINVIZ pricing options that traders can choose from, depending on the tools and features that they want to use. The pricing options include:
1. Free
If you are a first time user of FINVIZ, you can use the website without requiring any sign-up or logging in. Free users get access to the basic features and tools that do not require saving data. The free option offers three to five delayed maps, groups, quotes, and charts. To access the more advanced features, the users must choose one of the two other options.
2. Registered
The registered option requires users to sign up on the website. Doing so enables them to use additional FINVIZ features. The registration process is simple, and it takes less than three minutes. Registered users get access to daily charts and graphsTypes of GraphsTop 10 types of graphs for data presentation you must use - examples, tips, formatting, how to use them for effective communication and in presentations., limited screener results, portfolio tickersTickerA Ticker is a symbol, a unique combination of letters and numbers that represent a particular stock or security listed on an exchange. The ticker symbol is used to refer to a specific stock, particularly during trading. Trades are executed based on a company's ticker symbols, 50 screener presets, along with all the free access features. The option does not require users to pay and offers limited features compared to the elite pricing option.
3. Elite
The FINVIZ elite plan is the paid version for premium customers. It provides access to all the features available to free and registered users, as well as premium features that are not otherwise available. Some of the premium features offered in the elite option include pre-market and real-time quotes, advanced charting, backtesting, alerts, no-ads platform, real-time maps, emails on new alerts, and up to 100 screener presents.
The monthly elite plan subscription costs $39.50. Users can save money b opting for the annual subscription which costs $299.50. Both the monthly and annual payment plans offer the same level of access to premium features.
Data Visualization Course
Looking to bring your charts and graphs to life with amazing visual displays? Check out CFI’s Dashboards and Data Visualization Course to take your chartings skills to a whole new level!
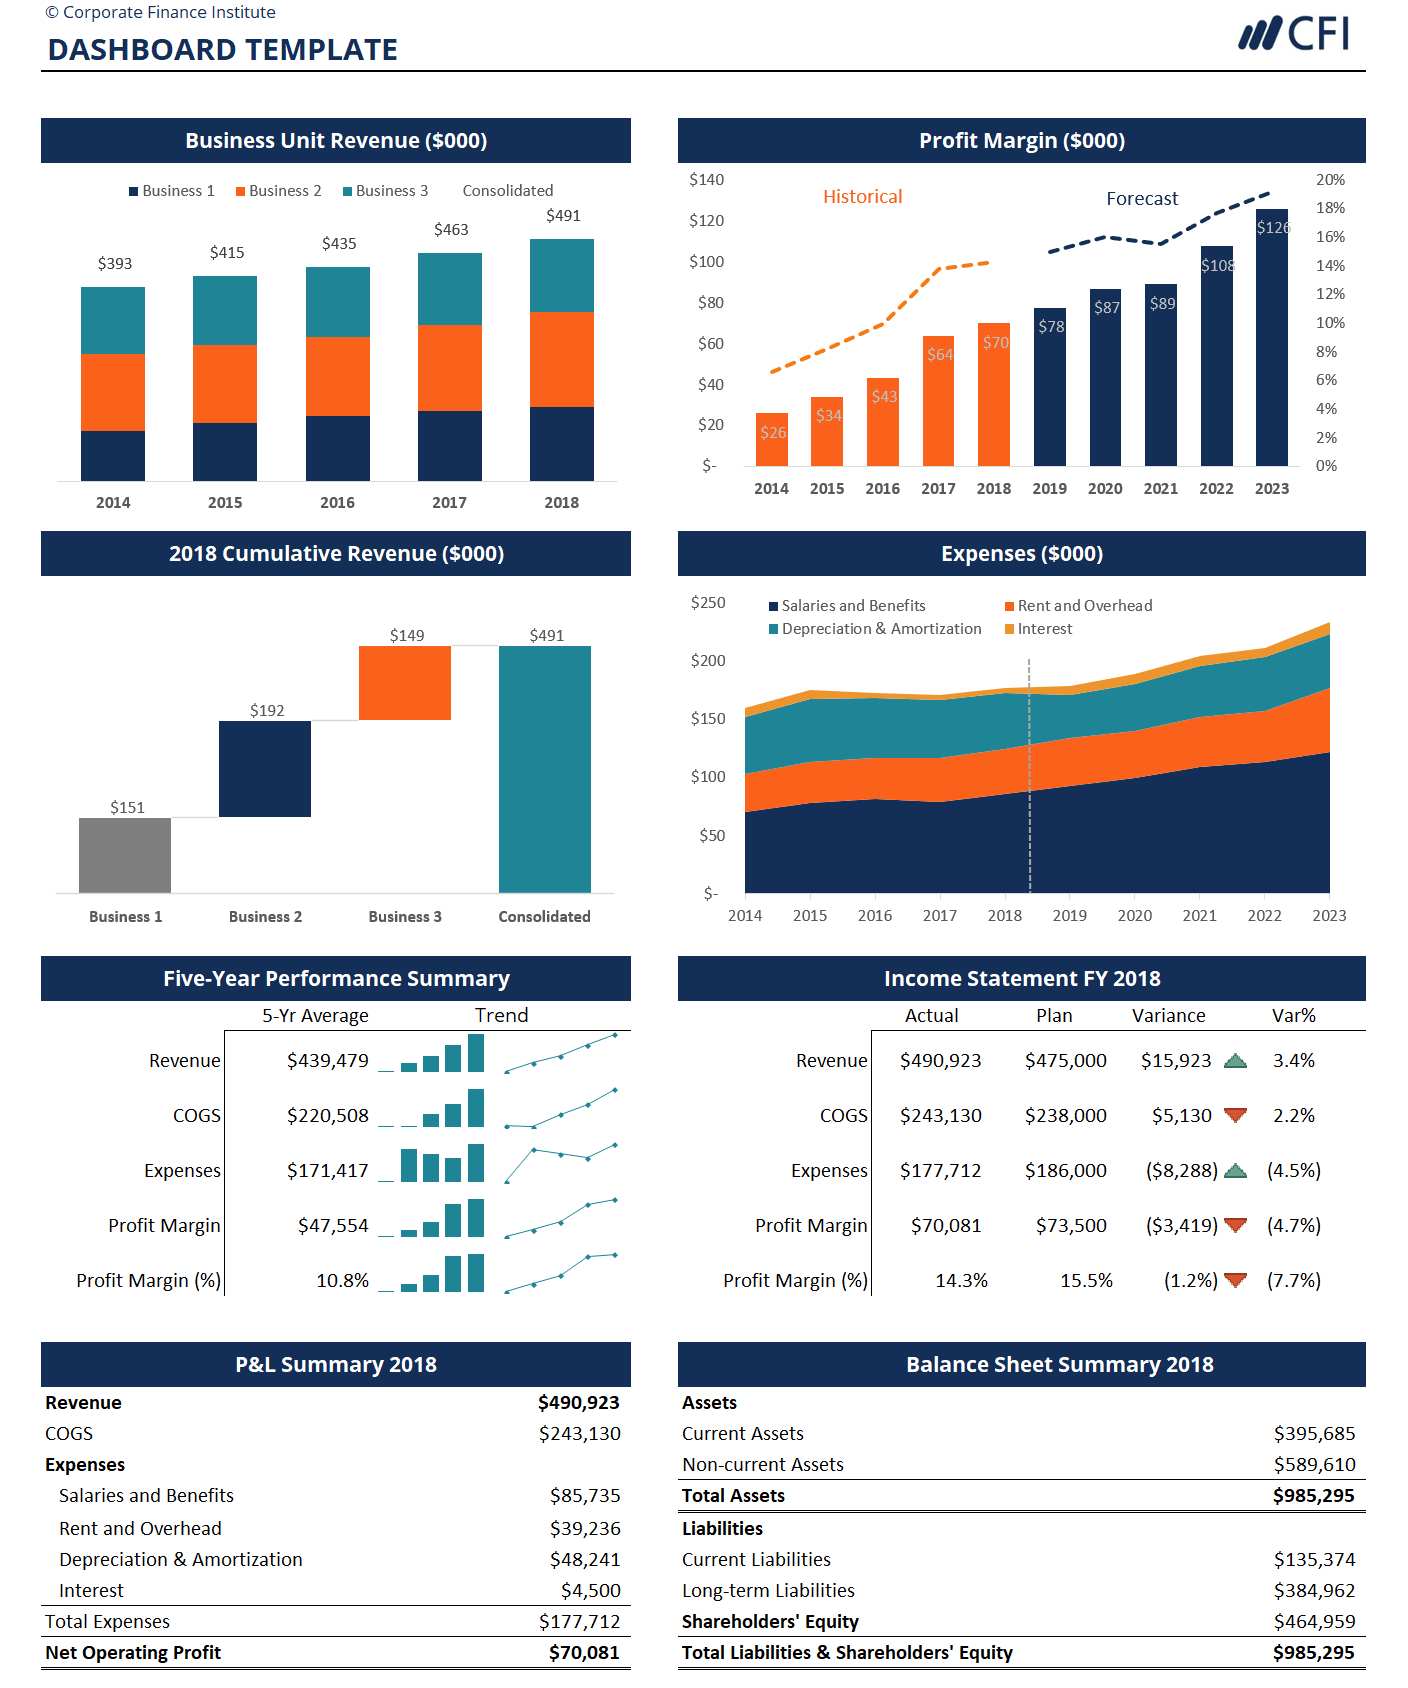
Image: CFI’s Dashboards and Data Visualization Course
Features of FINVIZ
The following are the main features of FINVIZ:
1. News
FINVIZ includes a news feed that provides the latest financial news that can help in choosing stocks and making decisions on whether to enter or exit a trade. The news headlines are sourced from some of the leading news providers, such as Bloomberg, MarketWatch, the New York Times, CNBC, and the Wall Street Journal. The platform also streams blogs from third-party sources like Seeking AlphaSeeking Alpha Login For a Resume BoostWith the rise of Seeking Alpha, there are many students who publish articles on SA. Can it be used on your resume? SA is a crowd-sourced article/equity research website, Mish Talk, Zero Hedge, and Calculated Risk. The news feed can be arranged according to source or time.
2. Screener
A screener is a more advanced tool that allows users to filter/sort stocks using descriptive, technical, or fundamental indicators. Users can input various indicators and identify the various stocks that fit their criteria. They can filter stocks based on price, market cap, average volume, betaBeta CoefficientThe Beta coefficient is a measure of sensitivity or correlation of a security or an investment portfolio to movements in the overall market., float short, profit marginProfit MarginIn accounting and finance, profit margin is a measure of a company's earnings relative to its revenue. The three main profit margin metrics, chart patterns, or specific candlestick patterns. Users have total control of their scans, and they can choose to save results for later use (must be registered users to save data). The screener feature is available to all categories of users.
3. Heat maps
Heat maps are visual tools that give traders an overview of how a specific stock is performing, and they allow quick browsing and analysis of large volumes of market data. Users can view the maps of a particular group, country, sector, exchange, or industry. The maps show which stocks are significantly moving, the direction in which they are moving, and the magnitude of the movements. The stocks are color coded for easy identification of well-performing stocks and those on the decline.
4. Sectors
The FINVIZ group tab provides an overview of how various sectors and industries have been performing. Stocks can be categorized based on specific performance metrics such as market capitalizationMarket CapitalizationMarket Capitalization (Market Cap) is the most recent market value of a company’s outstanding shares. Market Cap is equal to the current share price multiplied by the number of shares outstanding. The investing community often uses the market capitalization value to rank companies, P/E ratioPrice Earnings RatioThe Price Earnings Ratio (P/E Ratio is the relationship between a company’s stock price and earnings per share. It provides a better sense of the value of a company., EPSEarnings Per Share (EPS)Earnings per share (EPS) is a key metric used to determine the common shareholder's portion of the company’s profit. EPS measures each common share's profit, etc. Users can choose to get the data displayed in a bar chart, tabular form, grid, or chart.
5. Insider sales tracking
Under insider tracking, users can view the most recent insider transactions, their value, the number of shares and the individual/institution that made the transaction. The feature offers a great way to identify potential trades by viewing the latest insider transactions by top executivesCEO vs. CFOPeople outside the business world often get confused with the roles played by the CEO vs. CFO. The Chief Executive Officer (CEO) and the Chief Financial Officer (CFO) take on different but equally important responsibilities in an organization. in the open market.
6. Futures
There is a futures tab which allows users to track the progress of the futures market, identify contracts prices, and see by how much they have changed. The futures are color-coded on a map to provide an easy visual correlation with the various futures contracts.
7. Cryptocurrency
The crypto page shows the various cryptocurrenciesCryptocurrencyCryptocurrency is a form of digital currency that is based on blockchain networking. Cryptocurrency like Bitcoin and Ethereum are becoming widely accepted., and how they are performing in the market. They are color-coded for easy data visualization.
Related Readings
Thank you for reading CFI’s explanation of FINVIZ. CFI offers the Financial Modeling & Valuation Analyst (FMVA)™Become a Certified Financial Modeling & Valuation Analyst (FMVA)®CFI's Financial Modeling and Valuation Analyst (FMVA)® certification will help you gain the confidence you need in your finance career. Enroll today! certification program for those looking to take their careers to the next level. To keep learning and advancing your career, the following resources will be helpful:
- How to Read Stock ChartsHow to Read Stock ChartsIf you’re going to actively trade stocks as a stock market investor, then you need to know how to read stock charts. Even traders who primarily use fundamental analysis to select stocks to invest in still often use technical analysis of stock price movement to determine specific buy and sell, stock charting
- Primary MarketPrimary MarketThe primary market is the financial market where new securities are issued and become available for trading by individuals and institutions. The trading activities of the capital markets are separated into the primary market and secondary market.
- Technical Analysis – A Beginner’s GuideTechnical Analysis - A Beginner's GuideTechnical analysis is a form of investment valuation that analyses past prices to predict future price action. Technical analysts believe that the collective actions of all the participants in the market accurately reflect all relevant information, and therefore, continually assign a fair market value to securities.
- Trading MechanismsTrading MechanismsTrading mechanisms refer to the different methods by which assets are traded. The two main types of trading mechanisms are quote driven and order driven trading mechanisms
-
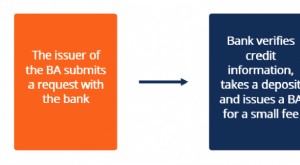
Banker's Acceptance: Definition, Function & Key Features
A banker’s acceptance refers to a financial instrument that represents a promised future payment from a bank. It states the name of the entity to which the funds need to be transferred, along wi
-
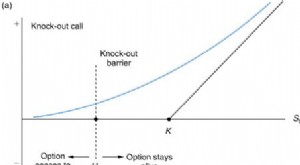
Barrier Options: Understanding and Trading Strategies
A barrier option is a type of derivative option contract, the payoff of which depends on the value of the underlying asset. In other words, the payoff only comes into effect if the asset underlying th
invest
- PC Banking: A Comprehensive Guide to Online Banking Security & Features
- IRA CDs: Secure Retirement Savings with FDIC Insurance
- Understanding the DU: Your Mortgage Approval Explained
- Decentralized Finance (DeFi): A Comprehensive Overview
- Jumbo CDs: Higher Rates & Deposits Explained
- Understanding Cryptocurrency: A Beginner's Guide to Digital Currency
- DB(k) Plans: A Hybrid Retirement Solution for Employers & Employees
- Choosing the Right Computer: A Practical Spending Guide
- Understanding Regulation Z: Your Rights as a Borrower
-
 Understanding Average Return: A Simple Guide
Average return is the mathematical average of a sequence of returns that have accrued over time. In its simplest terms, average return is the total return over a time period divided by the number of p...
-
 Backtesting: A Comprehensive Guide to Strategy Validation
Backtesting involves applying a strategy or predictive model to historical data to determine its accuracy. It can be used to test and compare the viability of trading strategies so tradersSix Essentia...