Golden Cross: Understanding a Powerful Trading Signal
A Golden Cross is a basic technical indicatorTechnical Analysis - A Beginner's GuideTechnical analysis is a form of investment valuation that analyses past prices to predict future price action. Technical analysts believe that the collective actions of all the participants in the market accurately reflect all relevant information, and therefore, continually assign a fair market value to securities. that occurs in the market when a short-term moving average (50-day) of an asset rises above a long-term moving average (200-day). When traders see a Golden Cross occur, they view this chart pattern as indicative of a strong bull marketBullish and BearishProfessionals in corporate finance regularly refer to markets as being bullish and bearish based on positive or negative price movements. A bear market is typically considered to exist when there has been a price decline of 20% or more from the peak, and a bull market is considered to be a 20% recovery from a market bottom..
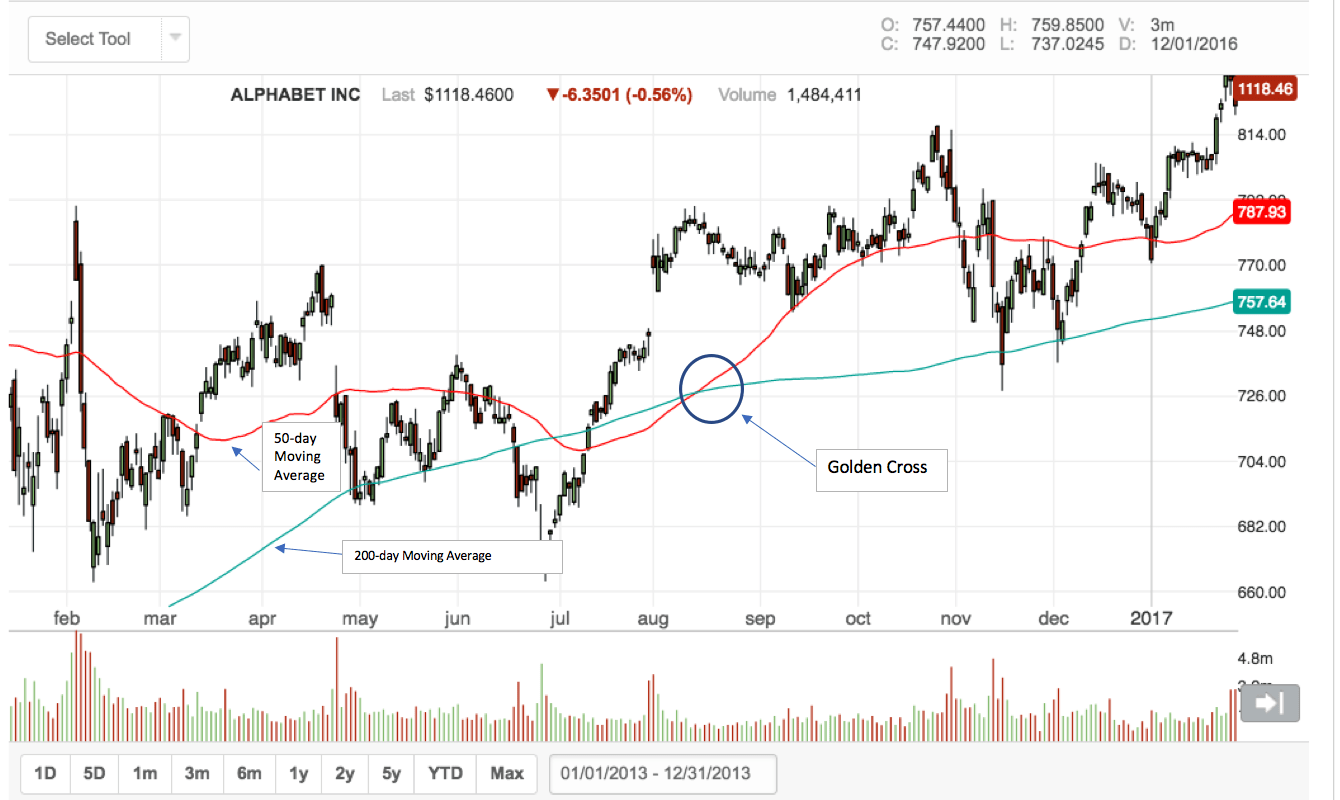
Chart Source
Many investors view the Golden Cross as a “holy grail” chart pattern. They consider it one of the most definitive signals of a bull market and, therefore, a strong buy signal. However, there are also analysts who question the validity of the Cross pattern. They do so because of the limited research to detail and prove its legitimacy as a trading mechanismTrading MechanismsTrading mechanisms refer to the different methods by which assets are traded. The two main types of trading mechanisms are quote driven and order driven trading mechanisms. The most recent evaluation opportunity is in favor of the Golden Cross. Since the pattern last occurred in the S&P 500 Index, the index has gone up by more than 50%
There is a second, converse indicator – the Death Cross – which is the inverse of the Golden Cross. The Death Cross occurs when a security’s 50-day moving average crosses from above to below its 200-day moving average. The Death Cross indicates a bear market going forward.
The Three Stages of a Golden Cross
There are three specific phases for the Golden Cross. The first phase is where a downtrend exists but is on its last legs because selling interest is being overpowered by stronger buying interest.
The second phase involves the emergence of a new uptrend. The breakout of the new uptrend is marked when the short-term average crosses from below to above the long-term average, forming the Golden Cross.
In the final phase, the new uptrend is prolonged, with continuing gains that confirm a bull market. During this phase, the Golden Cross’ two moving averages should both act as support levels when corrective downside retracements occur. As long as both price and the 50-day average remain above the 200-day average, the bull market is considered as remaining intact.
How to Use the Golden Cross
Traders can utilize the Golden Cross to help determine good times to both enter and exit the market. The indicator can also be a tool that traders can use to help them better understand when it makes sense to sell and when it’s better for them to buy and hold.
Traders looking to buy a securityMarketable SecuritiesMarketable securities are unrestricted short-term financial instruments that are issued either for equity securities or for debt securities of a publicly listed company. The issuing company creates these instruments for the express purpose of raising funds to further finance business activities and expansion. will sometimes enter the market when the security’s price rises above the 200-day moving average rather than waiting for the 50-day moving average to make the crossover. This is because the Golden Cross is often a significantly lagging indicator. It may not occur until well after the market has already turned from bearish to bullish.
Traders who sell short the market may use the golden cross as a signal that the bear market is over and it’s time to exit their positions.
The Golden Cross is applied to trading both individual securities and market indexes such as the Dow Jones Industrial Average (DJIA).
Some traders opt to use different moving averages to indicate a Golden Cross. For example, a trader might substitute the 100-day moving average in place of the 200-day. The pattern can also be looked for on shorter time frames, such as an hourly chart.
Finally, many analysts use complementary technical indicators to confirm the indication from a Golden Cross. Momentum indicators such as the Average Directional Index (ADX) or the Relative Strength Index (RSI) are popular choices. This is because momentum indicators are often leading, rather than lagging, indicators. Therefore, they can help in overcoming the Cross pattern’s tendency to significantly lag behind price action.
Resistance to the Cross Signal
Some traders and market analysts remain resistant to using the Golden Cross (and the Death Cross) as reliable trading signals. Their objections principally stem from the fact that the Cross pattern is frequently a very lagging indicator. Looking at the chart above, you can see the market bottomed out and turned to the upside at a price level substantially below where the Golden Cross occurred. The Cross pattern may provide limited predictive value for traders and be more valuable as confirmation of an uptrend, rather than as a trend change signal.
The Golden Cross is significant because it is a technical indicator used by many traders and analysts. The chart pattern is, therefore, likely to attract a significant amount of buying in a market. If it does, then it may become a sort of self-fulfilling prophecy. Traders see the pattern and buy the market, and their buying is sufficient to create or sustain a bullish trend.
Related Readings
CFI is a global provider of financial analyst training and oversees the Financial Modeling & Valuation AnalystBecome a Certified Financial Modeling & Valuation Analyst (FMVA)®CFI's Financial Modeling and Valuation Analyst (FMVA)® certification will help you gain the confidence you need in your finance career. Enroll today! certification program. To continue advancing your career, these additional resources will be helpful:
- Crack SpreadCrack SpreadCrack spread refers to the pricing difference between a barrel of crude oil and its byproducts such as gasoline, heating oil, jet fuel, kerosene, asphalt base, diesel fuel, and fuel oil. The business of refining crude oil into various components has always been volatile from the revenue point of view.
- MACD OscillatorMACD Oscillator - Technical AnalysisThe MACD Oscillator is used to examine short-term moving average convergence and divergence. The MACD Oscillator is a double-edged technical indicator in that it offers traders and analysts the ability to follow trends in the market, as well as gauge the momentum of price changes.
- Triangle PatternsTriangle Patterns - Technical AnalysisThe triangle patterns are common chart patterns every trader should know. Triangle patterns are important because they help indicate the continuation of a bullish or bearish market. They can also assist a trader in spotting a market reversal.
- TRIN IndicatorTRIN Indicator - Technical AnalysisThe TRIN indicator is short for trading index. The TRIN indicator, also known as the ARMS index because it was developed by Richard Arms, is functionally an oscillator type indicator that is primarily used to identify short-term overbought or oversold conditions in the stock market.
-

Decentralized Finance (DeFi): A Comprehensive Overview
DeFi is short for Decentralized Finance. DeFi describes decentralized lending, borrowing, and interest-bearing systems like Maker and Compound, most of which are Ethereum-based.
-

Jumbo CDs: Higher Rates & Deposits Explained
A jumbo CD is similar to a conventional CD although the former generally requires a higher deposit and accrues interest at a higher rate. A CD is a certificate of deposit that is offered by banks for
invest
- Golden Cross: Definition, Interpretation & Trading Signals
- Cross Guarantee: Definition, Purpose & Examples
- Cross Currency Settlement: A Comprehensive Guide
- Cross Currency Swaps: Definition, Mechanics & Benefits
- Cross-Currency Transactions: Definition & How They Work
- Cross Rates Explained: Understanding Currency Valuation
- Death Cross: Understanding Market Transitions & Trading Signals
- Understanding Cross-Holding: Risks & Implications
- Golden Share: Definition, Purpose & Government Use
-
IRA CDs: Secure Retirement Savings with FDIC Insurance
An Individual Retirement Account, referred to as an IRA, offers tax advantages to help you save for retirement. An IRA acts like a basket to hold different types of investments and assets. One of the ...
-
 Understanding the DU: Your Mortgage Approval Explained
DU in relation to a mortgage stands for Desktop Underwriter, which is a mortgage program used to analyze a borrower's application to see if it meets criteria set up by the governing agency of that...