Mean Reversion Explained: Understanding Price Cycles & Investing
Mean reversion is a theory implying that asset prices and historical returns gradually move towards the long-term mean, which can be based on the economy, industry, or average return within a set of data.
The greater the deviation from their mean, the higher probability that the next movement of asset prices will be closer to the mean. In other words, an extreme event that would increase or decrease the momentum of a stock would likely be followed by a less extreme event that would cause far less fluctuation.
Trading with Mean Reversion
Generally, mean reversion is used as a statistical analysis of market conditions to determine a trading strategy. For example, from the perspective of investing, strategies that involve mean reversion are comparing stocks or other securities whose price-performance greatly contrasts its historical average.
Applying that knowledge, investors are capable of measuring and determining when to buy under the mean and sell above it. Mean reversion is also used in options pricingOption Pricing ModelsOption Pricing Models are mathematical models that use certain variables to calculate the theoretical value of an option. The theoretical value of an to better determine how an asset’s volatility fluctuates along with its long-term average.
Under the assumption that assets will revert back to their mean, many traders attempt to capitalize on catalysts that affect the price action of the stock. Thus, in terms of buying and selling, traders profit from upswings and prevent losses on downswings.
How Catalysts Affect Mean Reversion
It is important to recognize that unexpected highs or lows can ultimately imply a shift in the nature of the stock, caused by events such as positive or negative news. For example, if news that Tesla just produced a new model is released to the public, there would likely be a positive shock in prices for a certain period of time before reverting to levels before the shock. The duration for when the stock reverts is called the time to reversion.
Generally, returns of normal patterns are not always guaranteed, but it is indeed still possible for assets to experience mean reversion in the most extreme circumstances. Nonetheless, much like any event, it is difficult to fully determine how market activity for securities will be affected by the news.
Random Walk
Instead of reverting back to the mean, stock prices may lead to a random walk post-shock. A random walk is a process when prices do not return to previous levels, nor do they gradually move towards the mean. For example, an increase in the momentum of the stock may lead to a greater deviation from the mean.
Complementary Technical Indicators and Financial Information
For traders, tools such as the Relative Strength Index (RSI)Relative Strength Index (RSI)The Relative Strength Index (RSI) is one of the most popular and widely used momentum oscillators. It was originally developed by the famed mechanical engineer turned technical analyst, J. Welles Wilder. The RSI measures both the speed and rate of change in price can be used to determine oversold or overbought price levels, which act as proxies to enter and exit mean reversion trades.
Standard deviation, Bollinger BandsBollinger Bands®"Bollinger Bands" are a technical analysis tool developed by John Bollinger in the 1980s for trading stocks. The bands comprise a volatility indicator that measures the relative high or low of a security's price in relation to previous trades., and money flow are used to determine the distance away from the long-term average; therefore, these tools can be used to track unusual price movements.
Regarding financial statements, many investors analyze earnings reports. If a company reports strong quarterly earnings due to positive news or development, it’s been mentioned that the next quarter’s report would likely be closer to the average.
Arguments Against Mean Reversion
1. Markets are efficient
Many individuals believe that markets reflect all available information and that it is impossible to outperform the markets unless insider informationInsider InformationInsider information, also called inside information, refers to non-public facts regarding a publicly traded company that can provide a financial advantage in the markets. In other words, insider information is knowledge and information on the operations, products/services pipeline is provided or some sort of illegal competitive edge’s been given.
For example, if a stock increases by 30%, there should be a cause behind that positive momentum. The stock may rise earlier than expected, potentially due to unreleased positive news. therefore, many people believe such price actions should not be possible before the announcement unless there is a specific, factual cause.
2. Poor performance indicators
With mean reversion indicators, such as Shiller’s CAPE, it’s been argued that many similar tools were tested using insufficient sample sizes. Thus, their results would be ineffective against the entire market.
Arguments for Mean Reversion
Although there are arguments against mean reversion trading strategies, many successful investors employed such an approach in the past and enjoyed a track record of success with it.
Long-term investors, such as Warren Buffett, use a contrarian type of investing strategy, which is fairly similar to mean reversion. Hedge fund founder Jim Simons of Renaissance Capital used mean reversion trading strategies to build capital.
More Resources
CFI is the official provider of the global Capital Markets & Securities Analyst (CMSA)® Program Page - CMSAEnroll in CFI's CMSA® program and become a certified Capital Markets &Securities Analyst. Advance your career with our certification programs and courses.certification program, designed to help anyone become a world-class financial analyst. To keep advancing your career, the additional CFI resources below will be useful:
- ContrarianContrarianA contrarian is an individual who acts in opposition to the majority. In terms of investing, a contrarian investor is someone who trades against prevailing market sentiments. When the market buys, they sell, and vice-versa.
- Momentum IndicatorsMomentum IndicatorsMomentum indicators are tools utilized by traders to get a better understanding of the speed or rate at which the price of a security changes. Momentum
- Chaikin Money Flow (CMF)Chaikin Money Flow (CMF)The Chaikin Money Flow (CMF) is an indicator created by Marc Chaikin in the 1980s to monitor the accumulation and distribution of a stock over a specified period. The default CMF period is 21 days. The indicator readings range between +1 and -1. Any crosses above or below 0 can be used to identify changes in money flow
- Directional Trading StrategiesDirectional Trading StrategiesDirectional options strategies are trades that bet on the up or down movement of the market. For example, if an investor believes the market is rising,
-
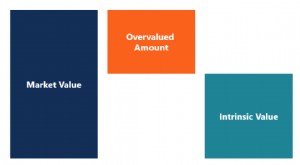
Understanding Overvalued Assets: A Comprehensive Guide
An overvalued asset is an investment that trades for more than its intrinsic value. For example, if a company with an intrinsic value of $7 per share trades at a market value $13 per share, it is cons
-
Understanding Underperformance: Causes, Effects & Solutions
In a general sense, underperforming refers to performing poorly or unsatisfactorily in comparison to expectations or when evaluated against a certain standard. For example, one can perform poorly by f
invest
- Understanding Prorated Payments: Definition & Calculation
- Quarterly Billing: Advantages, Disadvantages & What You Need to Know
- Understanding a $9,000 Salary: Annual Income Explained
- Understanding APY: Annual Percentage Yield Explained
- HODL Explained: The Origin and Meaning of a Bitcoin Term
- Understanding 'At Par': Definition & Implications in Finance
- Understanding Multi-Asset Class Investing: Diversification Explained
- Understanding Opportunity Cost: A Guide for Investors
- Kasasa: The Meaning Behind Our Name & Mission
-
 Margin Trading Explained: Borrowing to Invest in Stocks
Margin trading, or buying on margin, means offering collateral, usually with your broker, to borrow funds to purchase securities. In stocksStockWhat is a stock? An individual who owns stock in a compa...
-
 Understanding Illiquidity: Definition, Examples & Implications
Illiquid is a term commonly used to describe assets or investments that cannot be quickly and easily converted into cash at the current fair market price. An individual, a company, or other entity may...