Mean-Variance Analysis: A Guide for Investors
Mean-Variance Analysis is a technique that investors use to make decisions about financial instruments to invest in, based on the amount of risk that they are willing to accept (risk tolerance). Ideally, investors expect to earn higher returns when they invest in riskier assets. When measuring the level of risk, investors consider the potential variance (which is the volatility of returns produced by an asset) against the expected returnsExpected ReturnThe expected return on an investment is the expected value of the probability distribution of possible returns it can provide to investors. The return on the investment is an unknown variable that has different values associated with different probabilities. of that asset. Mean-variance analysis essentially looks at the average variance in the expected return from an investment.
The mean-variance analysis is a component of Modern Portfolio Theory (MPT). This theory is based on the assumption that investors make rational decisions when they possess sufficient information. One of the theory’s assumptions is that investors enter the market to maximize their returns while at the same time avoiding unnecessary risk.
When choosing a financial asset to invest in, investors prefer the asset with lower variance when given choosing between two otherwise identical investments. An investor can achieve diversification by investing in securities with varied variances and expected returns. Proper diversification creates a portfolio where a loss in one security is counter-balanced by a gain in another.
Main Components of Mean-Variance Analysis
Mean-variance analysis is comprised of two main components, as follows:
1. Variance
Variance measures how distant or spread the numbers in a data set are from the meanMeanMean is an essential concept in mathematics and statistics. In general, a mean refers to the average or the most common value in a collection of, or average. A large variance indicates that the numbers are further spread out. A small variance indicates a small spread of numbers from the mean.
The variance may also be zero, which indicates no deviation from the mean. When analyzing an investment portfolio, variance can show how the returns of a security are spread out during a given period.
2. Expected return
The second component of mean-variance analysis is expected return. This is the estimated return that a security is expected to produce. Since it is based on historical data, the expected rate of return Rate of ReturnThe Rate of Return (ROR) is the gain or loss of an investment over a period of time copmared to the initial cost of the investment expressed as a percentage. This guide teaches the most common formulasis not 100% guaranteed.
If two securities offer the same expected rate of return, but one comes with a lower variance, most investors prefer that security.
Similarly, if two securities show the same variance, but one of the securities offers a higher expected return, investors opt for the security with the higher return. When trading multiple securities, an investor can choose securities with different variances and expected returns.
Mean-Variance Analysis – Example: Calculating Expected Return
Assume a portfolio comprised of the following two stocks:
Stock A: $200,000 with an expected return of 5%.
Stock B: $300,000 with an expected return of 7%.
The total value of the portfolio is $500,000, and the weight of each stock is as follows:
Stock A = $200,000 / $500,000
= 40%
Stock B = $300,000 / $500,000
= 60%
The expected rate of return is obtained as follows:
= (40% x 5%) + (60% x 7%)
= 2% + 4.2%
= 6.2%
Investing Strategies
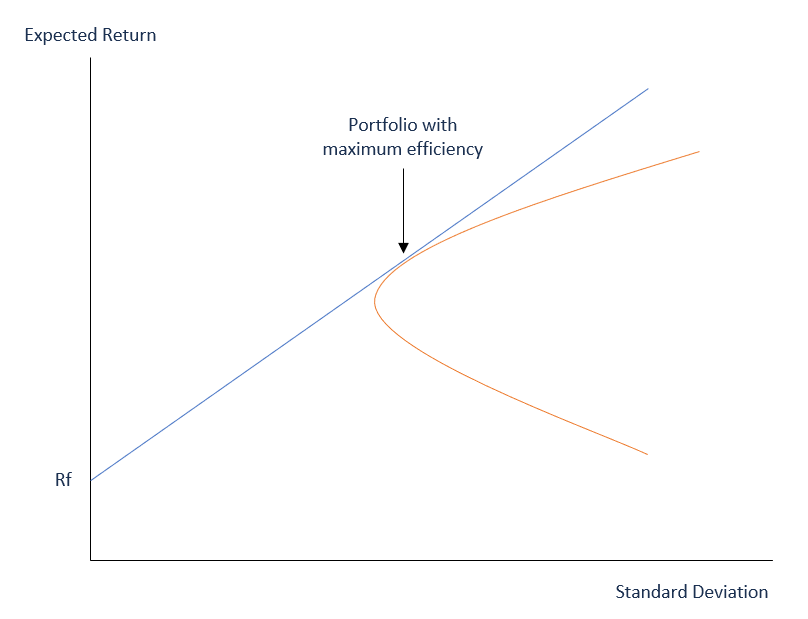
When creating an investment strategy, the goal of every investor is to create a portfolio of stocks that offer the highest long-term returns without getting into high levels of risk. Modern Portfolio Theory, which includes mean-variance analysis, is based on the idea that investors are risk-averse. Therefore, they focus on creating a portfolio that optimizes the expected return according to a specific level of risk. Investors understand that risk is an inherent part of high-return stocks. The solution for minimizing risk is to diversify the investment portfolio.
A portfolio can be comprised of stocks, bonds, mutual fundsMutual FundsA mutual fund is a pool of money collected from many investors for the purpose of investing in stocks, bonds, or other securities. Mutual funds are owned by a group of investors and managed by professionals. Learn about the various types of fund, how they work, and benefits and tradeoffs of investing in them, etc., which when combined, come with varying levels of risk. If one security decreases in value, ideally, the loss is compensated by a gain in another security.
A portfolio comprised of various types of securities is considered a better strategic move, as compared to a portfolio comprised of only one type of security. Mean-variance analysis can be an important part of an investment strategy.
Related Readings
We hope you’ve enjoyed reading CFI’s explanation of mean-variance analysis. CFI offers the Financial Modeling & Valuation Analyst (FMVA)™Become a Certified Financial Modeling & Valuation Analyst (FMVA)®CFI's Financial Modeling and Valuation Analyst (FMVA)® certification will help you gain the confidence you need in your finance career. Enroll today! certification program for those looking to take their careers to the next level. To keep learning and advancing your career, the following resources will be helpful:
- Investing: A Beginner’s GuideInvesting: A Beginner's GuideCFI's Investing for Beginners guide will teach you the basics of investing and how to get started. Learn about different strategies and techniques for trading
- Market Risk PremiumMarket Risk PremiumThe market risk premium is the additional return an investor expects from holding a risky market portfolio instead of risk-free assets.
- Portfolio VariancePortfolio VariancePortfolio variance is a statistical value that assesses the degree of dispersion of the returns of a portfolio. It is an important concept in modern investment theory. Although the statistical measure by itself may not provide significant insights, we can calculate the standard deviation of the portfolio using portfolio variance.
- Public SecuritiesPublic SecuritiesPublic securities, or marketable securities, are investments that are openly or easily traded in a market. The securities are either equity or debt-based.
-

Understanding Negative Investment Returns: Causes & Impact
A negative return represents an economic loss incurred by an investment in a project, a business, a stock, or other financial instruments. As a result of an investment failure, a negative return happe
-

Understanding Risk and Return in Investing
In investing, risk and return are highly correlated. Increased potential returns on investment usually go hand-in-hand with increased risk. Different types of risks include project-specific
invest
- Understanding Alpha: A Guide to Investment Performance
- Cash-on-Cash Return: Definition, Calculation & Importance
- Contribution Analysis: Understanding Profitability & Cost Management
- Credit Analysis: A Comprehensive Guide to Assessing Credit Risk
- Understanding Average Return: A Simple Guide
- Understanding Expected Return: A Comprehensive Guide
- Fundamental Analysis: A Comprehensive Guide to Investment Valuation
- Horizon Analysis: Predicting Portfolio Returns & Investment Strategies
- Understanding NAV Return: A Key Performance Indicator
-
 Annualized Rate of Return: Definition & Calculation
Annualized rate of return is a way of calculating investment returns on an annual basis. As we invest, we often want to know how much we are earning from our investments. When we calculate our investm...
-
 K-Ratio Explained: Measuring Investment Growth & Consistency
The K-Ratio is a statistical tool that helps us measure two things – the growth of return and the consistency of that growth over a specified period. It is often used to determine the risk vs. r...