SPY ETF: Understanding the SPDR S&P 500 - Performance & Investment
The Standard and Poor Depositary Receipts (SPDR) S&P 500 ETF is an exchange-traded fund that tracks the S&P 500 stock market index. The SPDR S&P 500 ETF is listed on the New York Stock ExchangeNew York Stock Exchange (NYSE)The New York Stock Exchange (NYSE) is the largest securities exchange in the world, hosting 82% of the S&P 500, as well as 70 of the biggest and trades under the ticker symbol SPY. The SPY’s price tracks the S&P 500 index.
The S&P 500 stock market index, which is made up of the 500 largest companies listed on U.S. stock exchanges, is considered the best indicator of the overall health of the U.S. economy and, to a larger extent, the world economy.

Therefore, SPDR S&P 500 ETF allows investors to track the performance of the U.S. economy without having to buy all the stocks listed on the S&P 500 directly. The SPY comes with an 0.09% expense ratioExpense RatioAn expense ratio is a fee charged by an investment company to manage the shareholders' funds. Investment companies such as mutual funds often incur various operating expenses when managing investors’ funds, and they charge a small percentage on the funds under management to cover the expenses., which is the ETF equivalent of fund management fees. An investor who invests $100,000 into the SPY ETF must pay $90 as management fees.
Summary
- The Standard and Poor Depositary Receipts (SPDR) S&P 500 ETF is an exchange-traded fund that tracks the S&P 500 stock market index. The SPDR S&P 500 ETF is listed on the New York Stock Exchange and trades under the ticker symbol SPY.
- The SPY’s price tracks the S&P 500 index.
- The SPDR S&P 500 ETF allows investors to track the performance of the US economy without having to buy all the stocks listed on the S&P 500 directly.
What is an ETF?
An exchange-traded fund (ETF) is an investment fund that comprises stocks and index fundsIndex FundsIndex funds are mutual funds or exchange-traded funds (ETFs) that are designed to track the performance of a market index. Currently available index funds track different market indices, including the S&P 500, Russell 2000, and FTSE 100.. ETFs are traded on stock exchanges (like stocks) and track the performance of some underlying asset or collection of assets (like index funds). They allow investors to diversify risks and invest in a broad basket of securities without directly purchasing all of the securities.
ETFs also allow investors to take positions in certain specific industries. For example, an investor who is bullish on electric vehicles may invest in an electric vehicles-themed ETF that tracks a basket of electric vehicle-related stocks. They can include battery-producing companies and AI-based software companies.
History of the SPDR S&P 500 ETF
The SPDR S&P 500 ETF is the world’s largest ETF and tracks the performance of the S&P 500 stock market index. Initially known only as the Standard & Poor’s Depositary Receipts, it was launched in 1993 by State Street Global Advisors, an asset management company based in Boston, Massachusetts. The ETF was designed by Nathan Most and Steven Bloom. The SPDR S&P 500 ETF is the most widely traded ETF globally, with an average trading volume of 80 million shares.
S&P 500 vs. SPDR S&P 500 ETF
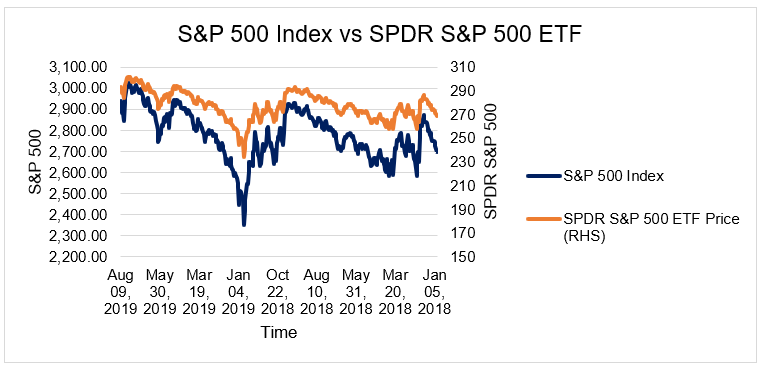
As can be seen from the graph above, the SPDR S&P 500 ETF does an excellent job of closely tracking the S&P 500 stock market index. However, it is not an exact tracker and does occasionally fail to track the S&P 500 effectively. Such errors are very small in magnitude and can be difficult to spot. The easiest way to spot the errors is to graph the two data series (the S&P 500 index and the SPDR S&P 500 ETF) in their first derivatives, i.e., their rates of change.
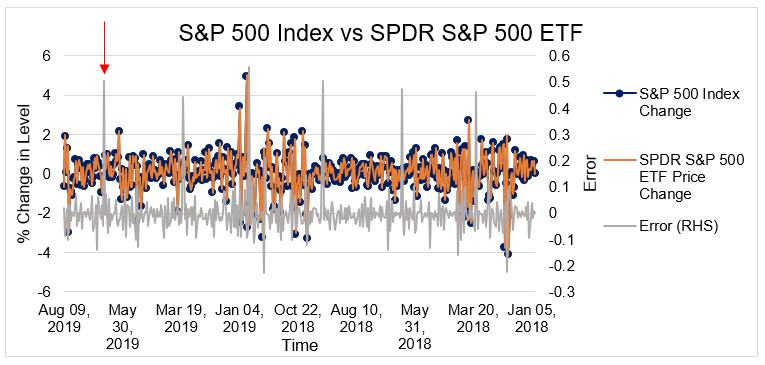
The blue line and the orange line plot the percentage change in the S&P 500 index and the SPY ETF, respectively. The black line plots the difference between the two series. For example, there is a 0.5% difference between the change in the S&P 500 index and the SPY ETF in June 2019 (marked by a red arrow). In this case, the change in the S&P 500 index was 0.5% more than the change in the SPY ETF.
Related Readings
CFI is the official provider of the Capital Markets & Securities Analyst (CMSA)®Program Page - CMSAEnroll in CFI's CMSA® program and become a certified Capital Markets &Securities Analyst. Advance your career with our certification programs and courses. certification program, designed to transform anyone into a world-class financial analyst.
To keep learning and developing your knowledge of financial analysis, we highly recommend the additional resources below:
- Investing: A Beginner’s GuideInvesting: A Beginner's GuideCFI's Investing for Beginners guide will teach you the basics of investing and how to get started. Learn about different strategies and techniques for trading
- Russell 2000Russell 2000The Russell 2000 is a stock market index that tracks the performance of 2,000 US small-cap stocks from the Russell 3000 index.
- Tracking ErrorTracking ErrorTracking error is a measure of financial performance that determines the difference between the return fluctuations of an investment portfolio and the return fluctuations of a chosen benchmark. The return fluctuations are primarily measured by standard deviations.
- Vanguard GroupVanguard GroupThe Vanguard Group is a privately-owned investment manager that was founded by John C. Bogle on May 1, 1975. Located in Malvern, Pennsylvania, Vanguard is the largest provider of mutual funds and is the second largest exchange-traded funds provider in the world after BlackRock’s iShares. Vanguard also offers brokerage
-
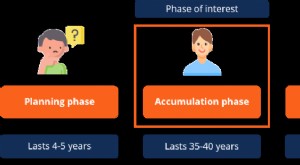
Understanding the Investment Accumulation Phase: Building Wealth Over Time
The accumulation phase refers to the time in the life cycle of an investment when an individual or an investor builds up the value of their annuity or investment. It is the second phase in the process
-

S&P 500 Average Annual Return: Historical Performance & Insights
The S&P 500 Index originally began in 1926 as the composite index comprised of only 90 stocks. According to historical records, the average annual return since its inception in 1926 through 2018
invest
- S&P 500 Dividend Aristocrats: Definition & Investment Insights
- Understanding the S&P 500: A Comprehensive Guide
- S&P 500 Ticker Symbol (^GSPC): What You Need to Know
- Understanding the S&P 500: Top Holdings & Long-Term Performance
- ETFs Explained: A Beginner's Guide to Exchange-Traded Funds
- Dow ETF vs. S&P 500 ETF: Which is Right for You?
- SPDR ETF: A Comprehensive Guide to Investing in the S&P 500
- ETF vs. Mutual Fund: Understanding the Key Differences
- ETFs Explained: Your Comprehensive Guide to Exchange-Traded Funds
-
S&P 500 vs. Russell 2000 ETFs: A Comprehensive Comparison
S&P 500 vs. Russell 2000 ETFs: An Overview If you find yourself on the conservative end of the active vs. passive spectrum, then investing in exchange-traded funds (ETFs) may be one way to ...
-
S&P 500 vs. Dow Jones ETFs: Which Investment is Right for You?
S&P 500 ETF vs. Dow Jones ETF: An Overview The exchange traded funds (ETF) that track the S&P 500 Index and the Dow Jones Industrial Average (DJIA) are some of the most widely trad...