TRIN Indicator: Understanding Market Sentiment & Short-Term Trends
The TRIN indicator, also known as the ARMS index because it was developed by Richard Arms, is functionally an oscillator-type indicator that is primarily used to identify short-term overbought or oversold conditions in the stock market. It does this by comparing advancing versus declining stocksStockWhat is a stock? An individual who owns stock in a company is called a shareholder and is eligible to claim part of the company’s residual assets and earnings (should the company ever be dissolved). The terms "stock", "shares", and "equity" are used interchangeably., along with advancing versus declining volume. TRIN is short for “TRading INdex”.
The TRIN indicator is referred to as a breadth indicator because it gives an indication of how widely spread, in terms of advances versus declines, a stock market movement is, as reflected in a major stock market index such as the S&P 500 Index or the NASDAQ 100 Index.
Because the TRIN indicator factors in both price advances or declines and volume figures, it is seen as indicating both the velocity (advances/declines) and mass (volume figures) of the stock market’s overall price movement.
Calculating the TRIN Indicator
Looking at the calculation for the TRIN indicator makes it very easy for a traderEquity TraderAn equity trader is someone who participates in the buying and selling of company shares on the equity market. Similar to someone who would invest in the debt capital markets, an equity trader invests in the equity capital markets and exchanges their money for company stocks instead of bonds. Bank careers are high-paying to understand what the TRIN reflects. The calculation for the TRIN is as follows:
(advances/declines) / (advancing volume/declining volume)
The TRIN first divides the number of advancing stocks for the day by the number of declining stocks for the day. It then divides the volume of advancing stocks by the volume of declining stocks. Finally, it divides the result of the first calculation by the result of the second calculation.
So, for example, if on a given day the number of advancing stocks was 2,275 and the number of declining stocks was 764, then the advance/decline ratio would be 2.98. If the total volume of advancing stocks was 1,176 and the total volume of declining stocks was 164, then the advance/decline volume ratio would be 7.17. The TRIN would then be calculated as:
2.98/7.17 = 0.42
Interpreting TRIN Values
Successfully using TRIN levels to indicate temporary overbought or oversold levels in a market can be a bit tricky. First of all, TRIN values appear to be inverse, in that higher values indicate increased selling while lower values indicate increased buying.
Generally speaking, TRIN values below 0.50 are considered to indicate overbought conditions in which analysts anticipate an impending corrective retracement downward. TRIN values above 3.00 are typically interpreted as indicative of oversold conditions that may give rise to an upside rally. A TRIN value of 1.00 indicates a balanced stock market that is neither overbought nor oversold.
One can quickly see that there’s a wide middle range of possible TRIN values between overbought values below 0.50 and oversold values above 3.00. In order to make the TRIN indicator more useful, analysts look not just at the basic TRIN values but also at how the TRIN value changes throughout a tradingKnowledgeCFI self-study guides are a great way to improve technical knowledge of finance, accounting, financial modeling, valuation, trading, economics, and more. day or over a longer period of time, such as during a trading week. By doing so, analysts can more precisely pinpoint what constitutes extreme levels, to one side or the other, in the TRIN under whatever the current market conditions are.
For example, the market might go through a period where TRIN values go no lower than 0.75 and no higher than 2.25. In such market conditions, analysts may determine that those two extreme values accurately reflect overbought and oversold conditions for the market during that specific time period, even though they fall short of what are typically the TRIN value levels that are considered to indicate overbought/oversold conditions.
Some traders and analysts who watch the TRIN indicator focus on the TRIN’s equilibrium value of 1.00 and consider any readings below 1.00 as potential indications of overbought conditions, and any readings above 1.00 as potential indications of oversold conditions.
Volatility Shortcoming of TRIN
One of the shortcomings of the TRIN indicator is that its value can fluctuate significantly either intraday or from one trading day to the next even under overall market conditions that would not usually be described as volatile.
In order to smooth out some of the inherent volatility in the TRIN indicator, some traders and analystsSell Side AnalystA sell side analyst is an equity research analyst who works for an investment bank or brokerage firm and produces investment research which is circulated to the firm's clients. The investment research is later used by the client to make a decision on whether to buy or sell prefer to look at a 10-day moving average of the TRIN value.
Using the TRIN
Analysts commonly use the TRIN indicator to identify market conditions under which the short-term market trend may soon shift from bullish to bearishBullish and BearishProfessionals in corporate finance regularly refer to markets as being bullish and bearish based on positive or negative price movements. A bear market is typically considered to exist when there has been a price decline of 20% or more from the peak, and a bull market is considered to be a 20% recovery from a market bottom. (when the market is temporarily overbought) or from bearish to bullish (when the market is temporarily oversold). Traders may use the trend to identify potentially profitable buying or selling price levels.
The chartHow to Read Stock ChartsIf you’re going to actively trade stocks as a stock market investor, then you need to know how to read stock charts. Even traders who primarily use fundamental analysis to select stocks to invest in still often use technical analysis of stock price movement to determine specific buy and sell, stock charting below shows that traders who bought into the market when the TRIN showed values above 3.00, indicating oversold conditions at the market levels indicated by the green up arrows, would have fared very well. However, traders who sold the market based on TRIN values below 0.50, indicating overbought conditions would not have been so profitable over the same time period.
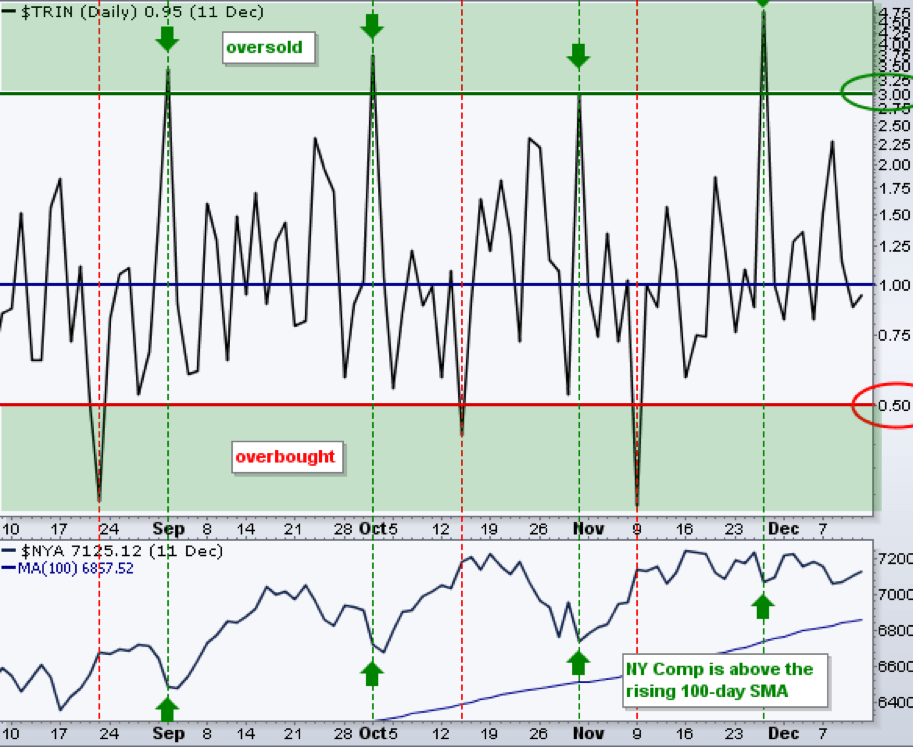
The TRIN is typically a leading indicator – one that projects a market turn before it happens. Looking at the above chart, one can easily see that the TRIN often anticipated an actual turn in the stock market direction by a day or two. While this may afford a trader an opportunity to “sell the top” or “buy the bottom”, most traders will look for confirming price action in stock market index values before investing based on an anticipated market reversal.
When TRIN values are relatively steady and around the 1.00 equilibrium level, many traders will stand aside and wait for further market action before making or adjusting any investments. Market activity that occurs without moving the TRIN indicator very much one way or the other is more likely to prove insignificant for the trading day.
Learn more
- Technical AnalysisTechnical Analysis - A Beginner's GuideTechnical analysis is a form of investment valuation that analyses past prices to predict future price action. Technical analysts believe that the collective actions of all the participants in the market accurately reflect all relevant information, and therefore, continually assign a fair market value to securities.
- Speed LinesSpeed Lines - Technical AnalysisSpeed lines are an analysis tool used to determine support and resistance levels. They are not intended to be used as a standalone technical indicator.
- ADX IndicatorADX Indicator - Technical AnalysisADX stands for average directional movement index. The ADX indicator is an indicator of trend strength, commonly used in futures trading. However, it has since been widely applied by technical analysts to virtually every other tradeable investment, from stocks to forex to ETFs.
- MACD IndicatorMACD Oscillator - Technical AnalysisThe MACD Oscillator is used to examine short-term moving average convergence and divergence. The MACD Oscillator is a double-edged technical indicator in that it offers traders and analysts the ability to follow trends in the market, as well as gauge the momentum of price changes.
-

Understanding Slippage in Trading: Causes & Impact
What Is Slippage? Slippage refers to the difference between the expected price of a trade and the price at which the trade is executed. Slippage can occur at any time but is most prevalent duri
-
Understanding Liquid Markets: Definition & Key Characteristics
What Is a Liquid Market? A liquid market a one with many available buyers and sellers and comparatively low transaction costs. The details of what makes a market liquid may vary depending on th
invest
- Market Basket: Understanding Market Basket Analysis & Index Funds
- Understanding Yo-Yo Markets: Volatility and Investment Strategies
- Understanding Bull Markets: A Comprehensive Guide
- Aroon Indicator: Trend Identification & Market Analysis | Investopedia
- Market Indicators: A Comprehensive Guide for Traders
- Arms Index (TRIN): Understanding Market Breadth & Technical Analysis
- Understanding Market Liquidity: A Guide for Investors
- Money Market Accounts vs. CDs: Which is Right for You?
- Super Bowl Indicator: Does Football Predict Stock Market Trends?
-
Spot Market Explained: Immediate Delivery of Financial Instruments
What Is a Spot Market? The spot market is where financial instruments, such as commodities, currencies, and securities, are traded for immediate delivery. Delivery is the exchange of cash ...
-
Understanding Counterparties in Financial Transactions: A Comprehensive Guide
What is a Counterparty? A counterparty is the other party that participates in a financial transaction, and every transaction must have a counterparty in order for the transaction to go through...