Option Pricing Analysis: Evaluating Value & Identifying Opportunities
Suppose you spot a stock that you think is poised for an upside breakout. You decide to try and capture some of that upside with an options play. So you bring up the Trade or Analyze tab on the thinkorswim® platform from TD Ameritrade and expand the Option Chain to find an expiration that works for you. You look at a few different out-of-the-money strikes and wonder: “Is this asking price too high, just right, or undervalued?” Smart question. But it’s nearly impossible to tell just by looking at the options prices.
Wouldn’t it be great if you could chart options prices so you can see their relative valuation?
It turns out you can. Let’s walk through the process in just four steps.
Step 1: Pull Up an Option Chain
On thinkorswim, select either the Analyze or Trade tab. Enter the ticker symbol of the underlying stock you’re looking to trade and pull up an Option Chain. Let’s say you select an expiration that’s between 20 and 30 days out and a strike price that’s actively traded.
The underlying price of the stock you’re looking at is trading at $3,441 (see figure 1). You’re considering the September 2020 3500 call option with a bid price of $111.25 and ask price of $113. Are those prices fair or a little steep? To answer this question, it would help to see how the option has moved in the past. And to do that, you can pull up a price chart for the option you’re considering. That’s right. You can chart an option just like a stock.
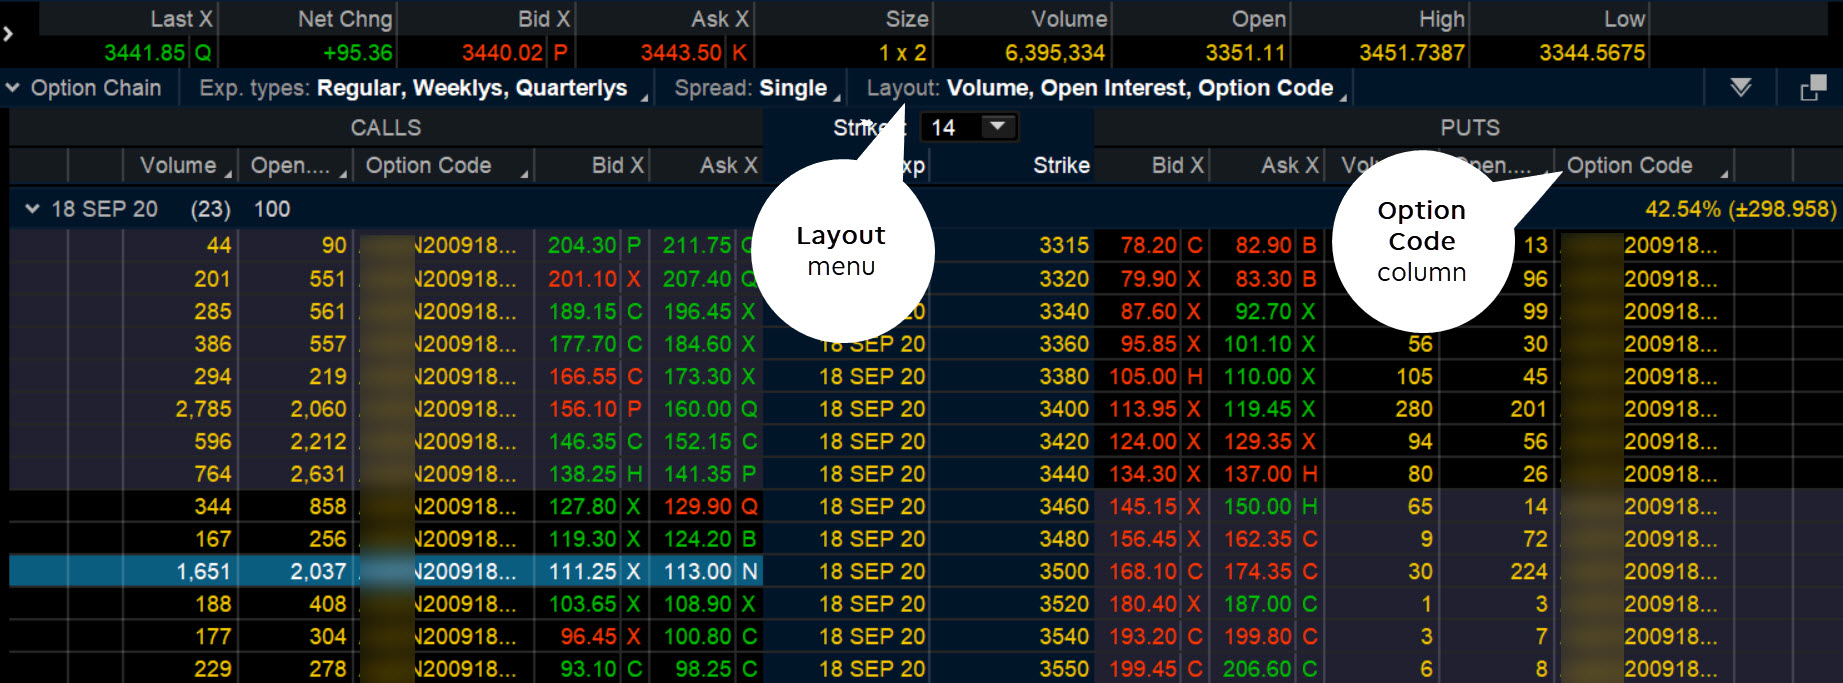
Step 2: Set Up the Option Code Column
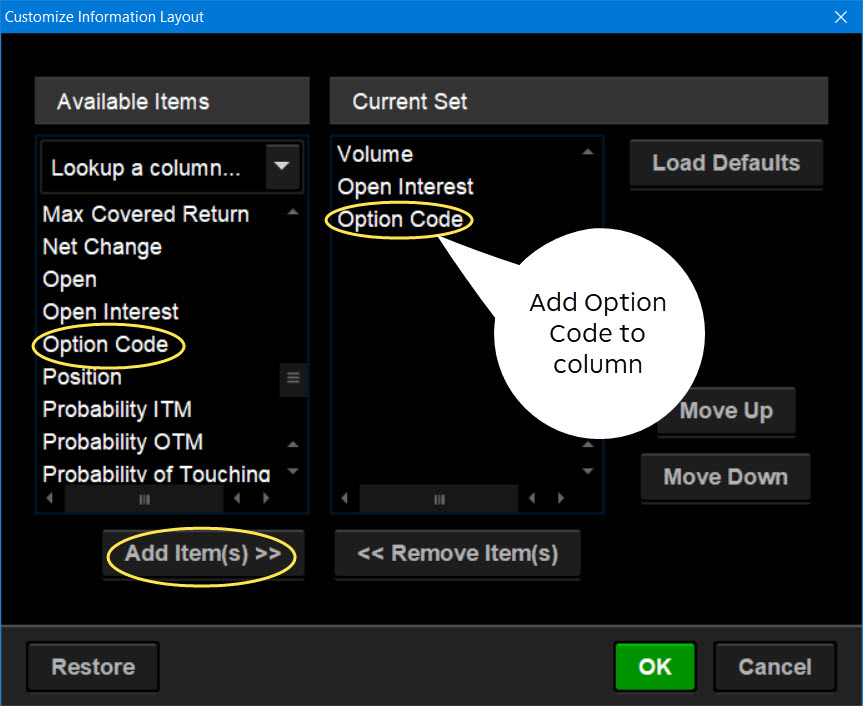
From the top of the Option Chain, select the Layout menu, then Customize. From here, you can customize your layout to include the option code for all options.
On the layout customizing window (see figure 2), scroll down to select Option Code > Add Item(s) > OK.
Now the Option Chain will display the corresponding option code for each strike price, as shown in figure 1.
Now, let’s go ahead and chart this code to see how the options charting tool works.
Step 3: Find and Copy an Option Code
To do this, right-click the September 3500 calls (for example), then copy the option code.
Next, open up the Charts tab and pull up a chart.
Step 4: Chart the Premium’s Theoretical Price
Paste the option code you just copied into the symbol box of the chart. The options price should populate your chart screen (see figure 3).
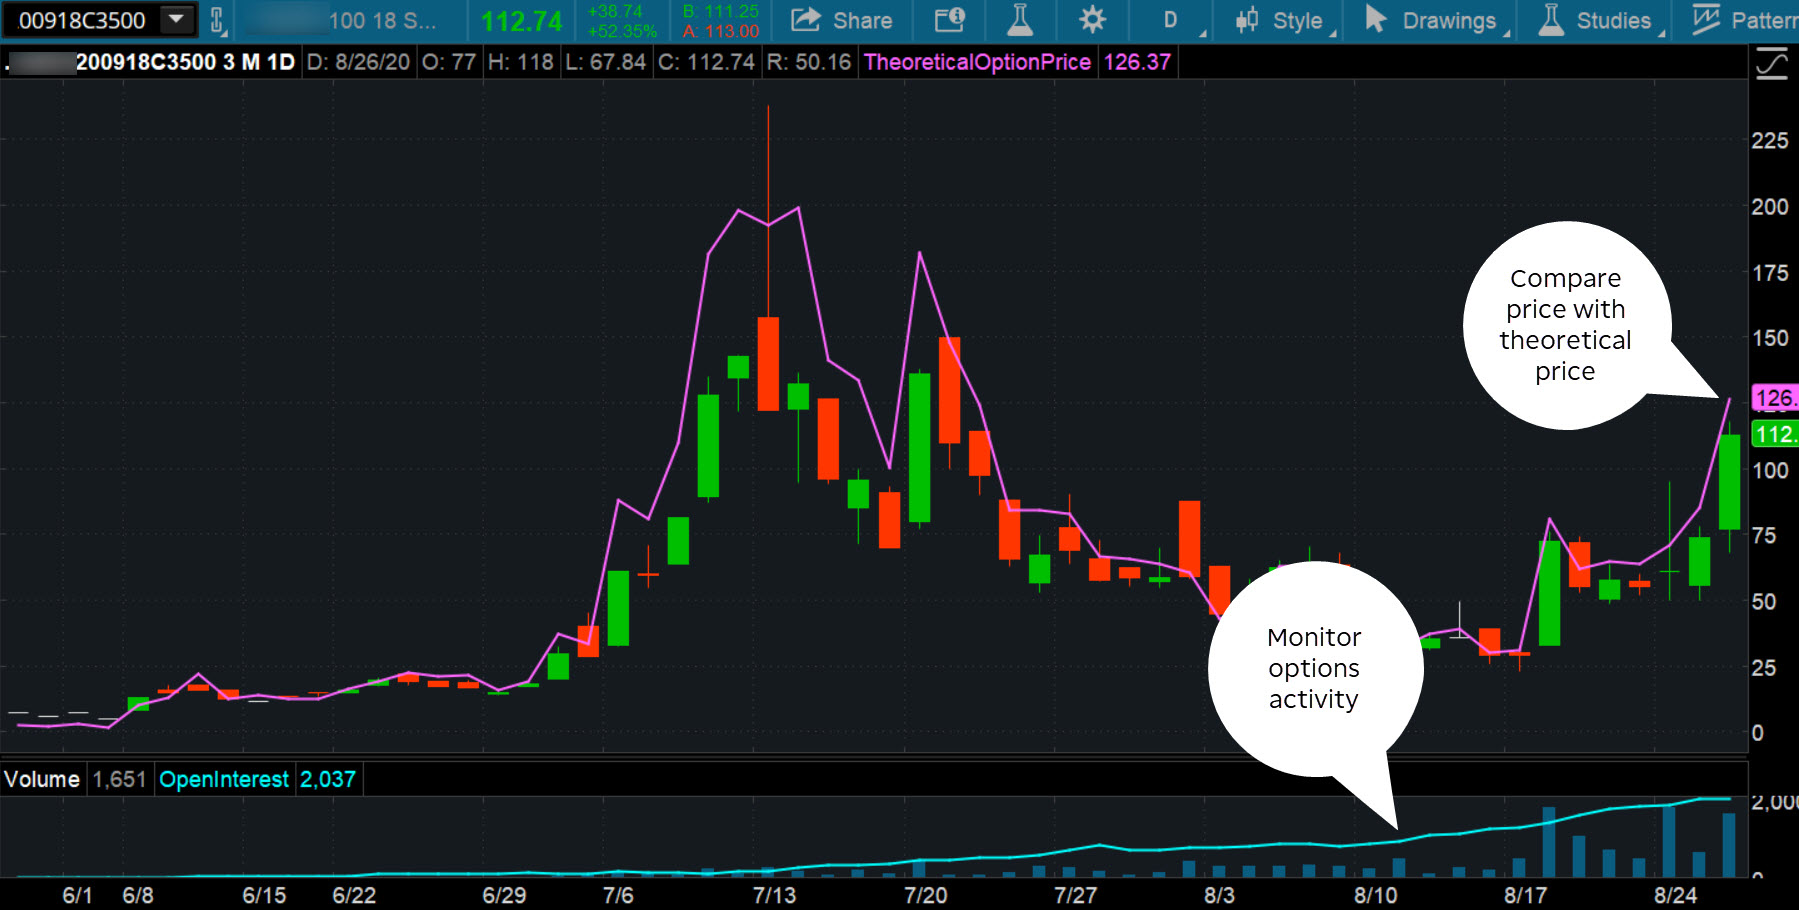
Not much different from a stock chart, is it? The biggest advantage? The price movement is now visual. You can see where the prevailing price is relative to past price movement. Overlaying the theoretical price (purple line) is helpful to determine where price is trading relative to the theoretical value. You can add studies, drawing tools, or any other charting analysis.
Note that when an option gets closer to expiration, trading activity increases. This is indicated in the volume and open interest plotted in the subchart. Of course, a more volatile option is probably going to have a greater price range.
Viewing options on a price chart gives you a different perspective and can help you determine if the option is too expensive, just right, or cheap. And that could ultimately help you with your options trading decisions.
Although there’s never a guarantee that you can execute a trade at your preferred price, the options charting feature at least helps you get a reference point for the options premium.
Visualizing Options
Options trading can be rife with numerous complexities, as the relationship between options premiums and the underlying stock price tends to be variable. Determining whether options premiums are overvalued, just right, or undervalued used to be a major issue because there’s no quick way to mentally calculate price. That left traders with no solid reference point to make buying or selling decisions. But fortunately, you can chart options premiums on thinkorswim, giving you a clearer perspective and perhaps more pricing choices to work with.
-

American vs. European Options: Key Differences Explained
When considering the difference between American options versus European options, it is important to keep in mind that there are several levels of analysis possible because they range from
-
Understanding Embedded Options in Preferred Stock: A Comprehensive Guide
There are a number of reasons why investors buy preferred stock. For instance, preferreds are sometimes used to speculate on interest rates because of their relatively high sensitivity to rate c
Option
- Understanding European Options: Definition & Key Features
- Understanding Options Pricing: A Guide to Greeks
- Binary Options Trading in the U.S.: A Comprehensive Guide
- Understanding Equity Options: Versatility and Market Resilience
- Options Hedging: A Beginner's Guide to Risk Management
- SPOT Options: Understanding Automated Option Exercise
- Understanding the Risks & Rewards of Cheap Out-of-the-Money Options
- Credit Spread Options: A Limited Risk, Limited Reward Strategy
- Understanding the Risks of Options Trading
-
Understanding Deep In The Money Options: A Comprehensive Guide
What Is Deep In The Money? Deep in the money is an option that has an exercise or strike price significantly below (for a call option) or above (for a put option) the market price of the underl...
-
Understanding Option Strike Prices: A Key to Options Trading
The strike price of an option is the price at which shares of the underlying security are bought and sold for if the option is exercised. This price is important because it forms the basis for d...