TD Ameritrade thinkorswim: Using the Risk Profile for Options Strategies
If you’re an option trader using the thinkorswim® platform from TD Ameritrade, odds are you’re familiar with the Risk Profile tool. Not only can it provide a single visual risk snapshot, but it can also help you estimate changes in a trade’s profile given certain changes in risk components such as time and volatility. From the basic long call option to a complex, multi-leg ratio spread, think of the Risk Profile as the Swiss Army knife of options analysis.
Ready to see it in action? Let’s start with a vertical spread—the purchase of a call or put option, paired with the sale of another call or put of the same expiration month, but with a different strike. (Need a refresher? Read about the basics of vertical spreads and selling vertical credit spreads.)
The following, like all of our strategy discussions, is strictly for educational purposes. It is not, and should not be considered, individualized advice or a recommendation.
Make That Vertical Leap
Building a vertical spread using the Risk Profile tool is about as simple as entering a one-leg order such as a long call—there are just a couple selections to make. On the Analyze tab, select Add Simulated Trades and enter your ticker symbol. Start by right-clicking on a strike that you'd like as part of your vertical spread and then select Analyze buy trade or Analyze sell trade (see figure 1). This will bring up a menu of spread choices. Select Vertical (or whatever’s your spread du jour).
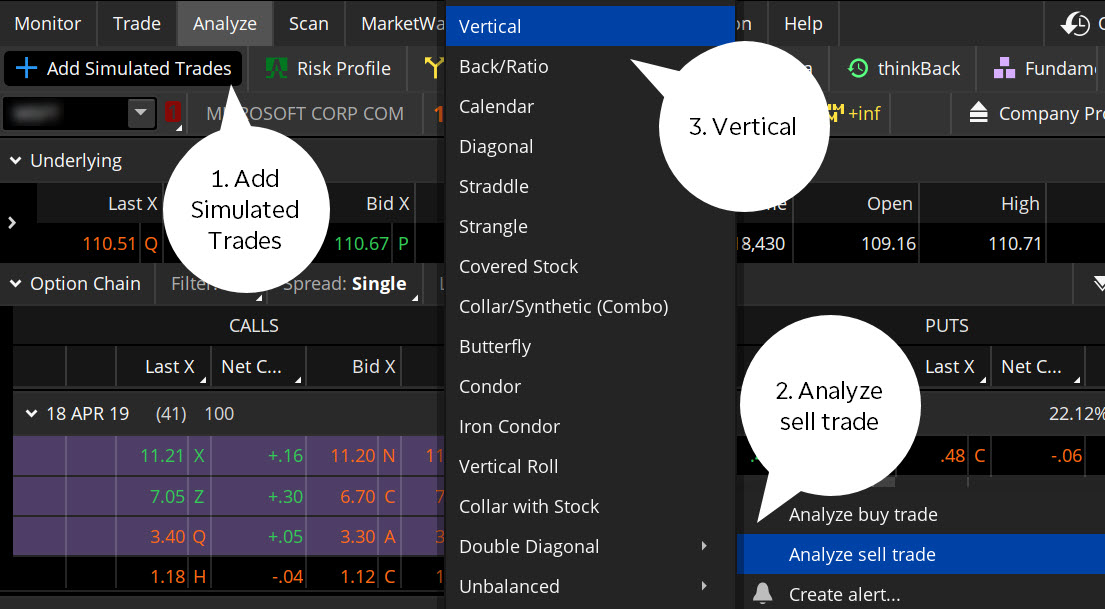
FIGURE 1: ANALYZE A VERTICAL SPREAD. To analyze a spread, right-click any strike and choose the strategy. Chart source: the thinkorswim® platform from TD Ameritrade. For illustrative purposes only. Past performance does not guarantee future results.
As an example, we’ll analyze selling the 105-100 vertical put spread, which is the sale of the 105-strike put and the purchase of a 100-strike put. In our example we’re selling the spread for a credit of $0.61 (times the options multiplier of 100 = $61, minus transaction costs).
To get the visual display of the simulated trade, under the Analyze tab, select the Risk Profile subtab (right next to Add Simulated Trades). You’ll see a chart of potential outcomes for the trade (see figure 2). Remember that this is an estimation based on theoretical values; trades in the real market might perform differently.
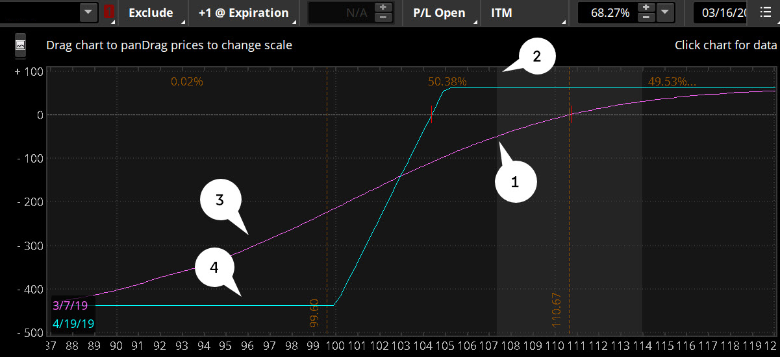
FIGURE 2: RISK PROFILE OF A SHORT VERTICAL PUT SPREAD. The chart shows a risk profile of one 105-100 short put spread sold for $0.61. The purple line is the present-day profile; the blue line shows the profile on the options expiration date. Chart source: the thinkorswim® platform from TD Ameritrade. For illustrative purposes only. Past performance does not guarantee future results.
Scenarios and the Numbers Behind Them
The blue line in figure 2, which represents the profit and loss (P&L) of the trade at expiration, has two kinks in it. Those are the strike prices of the spread. The purple line is the estimation of the spread’s P&L as the price of the underlying changes. For instance, if the underlying were to go to $107 today (1), the trade would be down about $47. But then if the underlying remained at that level until expiration (2), the trade could end up making $61. Both legs would expire worthless, and you’d keep the premium minus transaction costs.
The graph demonstrates how the passage of time helps this trade if the underlying stays above the high strike of 105. However, if the underlying drops to $96 today (3) and stays there until expiration (4), today’s loss of about $300 would become a full loss of $439 by expiration. Why? Because if both strikes finish in the money, you’ll be assigned a long stock position at $105 per share and you’ll exercise your 100-strike put, selling your stock at $100 per share and essentially locking in a $5 loss. But you collected a $0.61 credit when you sold the spread, so your net loss would be $4.39 times the contract multiplier of 100, or $439, plus transaction costs.
And remember, you can analyze the trade using other future dates prior to expiration, and at other levels of implied volatility, by using the Lines and Step buttons.
Do you have multiple positions within that same stock? Do you have a position in the stock itself? A complex, multi-leg spread? More than one expiration date? This tool can give you a single visual display.
Are options the right choice for you?
While options trading involves unique risks and is definitely not suitable for everyone, if you believe options trading fits with your risk tolerance and overall investing strategy, TD Ameritrade can help you pursue your options trading strategies with powerful trading platforms, idea generation resources, and the support you need.
Learn more about the potential benefits and risks of trading options.
-

Investment Risk Assessment: A Comprehensive Guide for Investors
Understanding all of the different types of investment risk is essential if you are going to be a successful investor. When you are researching a company, you need to do your best to identify al
-
Top 3 High-Return Investment Strategies for 2024
In present times, more than ever, people are wondering what the best investment options. While high returns can never be guaranteed in the financial markets, there are several strategies you can
Option
- Understanding Options Pricing: A Guide to Greeks
- Vertical Spreads: Calculate Risk & Profit Potential
- Vertical Spreads vs. Single-Leg Options: A Risk & Reward Comparison
- Condor Spread Strategy: A Guide for Volatile Markets
- Box Spread Trading Strategy: A Beginner's Guide
- Horizontal Spread Strategy: Capitalize on Time Value Discrepancies
- Credit Spread Options: A Limited Risk, Limited Reward Strategy
- Bear Call Spread: A Beginner's Guide to Profiting from Market Declines
- Bull Vertical Spread Strategy: A Beginner's Guide to Profitable Options Trading
-
 Understanding Key Risks Facing Banks: A Comprehensive Overview
Major risks for banks include credit, operational, market, and liquidity risk. Since banksFinancial IntermediaryA financial intermediary refers to an institution that acts as a middleman between two p...
-
Calendar Spreads: A Guide to Profit from Time Spreads
A calendar spread is used for taking advantage of the difference in different delivery month prices as opposed to speculating on the future price. In other words, the difference in the two deliv...