Death Cross Explained: Understanding its Significance in Crypto (and Beyond)
TL;DR
- The death cross is a commonly referenced technical analysis setup, such a setup occurs when the 50-period MA crosses below the 200-period MA.
- No setup or method is foolproof.
- The Death Cross and Golden Cross can be subject to fake-outs.
Technical analysis in the cryptocurrency space, or any market for that matter, is complicated. Influencers and analysts often spout out enough terms and phrases to make a newcomer’s head spin. One such term is the dreaded “death cross.”
The death cross is commonly touted as an ominous sign during downward crypto price action, indicating possible further significant downward movement. The event occurs on price charts when two specific moving averages intersect on a path downward.
In technical analysis, three moving averages (MA) are commonly referenced in their relation to price: the 50-period MA, 100-period MA, and the 200-period MA. The 50-day MA and the 200-day MA appear to be the most commonly used MAs when looking for a death cross.
In the crypto space, bitcoin’s death cross earlier this year appears to have been a powerful turning point for crypto’s previously bullish trend, as seen in bitcoin’s daily Bitfinex chart below (with the death cross circled in green). The crypto market still shows signs of an intense bear market almost ten months after bitcoin’s daily MA death cross.
After the death cross, the price can be seen approaching the red 200-day moving average several times although each attempt faced rejection.
Like any technical analysis tool or method, the death cross is not foolproof. Many technical indicators can also fall prey to price fake-outs.
Bitcoin’s last bear market also posted a death cross. In this example, however, the 50-day MA crossed back above the 200-day MA for some time before returning below the 200-day MA.
Meet the Golden Cross
Inversely, the Golden Cross occurs when the 50-period MA crosses above the 200-period MA, possibly indicating bullish sentiment and future bullish action.
Even the best technical analysis often may only provide a slight advantage in anticipating future price action. Additionally, technical analysis is a game of confluence. Many price clues in congruence often rule over a single clue.
-
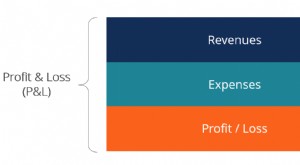
Profit & Loss Statement (P&L): Definition & Key Components
A profit and loss statement (P&L), or income statement or statement of operations, is a financial report that provides a summary of a company’s revenues, expenses, and profits/losses ov
-

Understanding CEO Bonuses: Structure, Calculation & Compensation
In the corporate world, a CEO bonus typically is an incentive-based annual payment to the chief executive officer of a company that is over and above that executive’s salary. The CEO bonus
Blockchain
- Death Cross: Understanding Market Transitions & Trading Signals
- Harami Cross: A Complete Guide to This Bullish Candlestick Pattern
- Bitcoin at $44,000: Expert Analysis & Investment Strategies
- Decoding Finance: A Simple Guide to Investment Terms
- Blockchain ETFs vs. Bitcoin ETFs: Understanding the Key Differences
- Q2 Market Outlook: Navigating Volatility and Potential Opportunities
- Crypto Fear & Greed Index: Understanding Market Sentiment
- 51% Attack on Cryptocurrencies: Risks, Methods, and Real-World Examples
- Web3 Explained: The Next Evolution of the Internet?
-
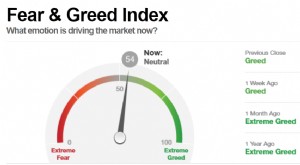 Fear & Greed Index: Understanding Investor Sentiment | CNN Business
The Fear and Greed Index, developed by CNNMoney, is used to gauge whether investors are too bullish or bearish on the stock market. The index ranges from 0 (extreme fear) to 100 (extreme greed). ...
-
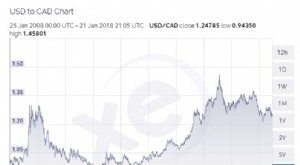 USD/CAD Currency Pair: Understanding the US Dollar to Canadian Dollar Exchange
The USD/CAD currency pair represents the quoted rate for exchanging US to CAD, or, how many Canadian dollars one receives for every US dollar. For example, a USD/CAD rate of 1.25 means 1 US doll...