Fear & Greed Index: Understanding Investor Sentiment | CNN Business
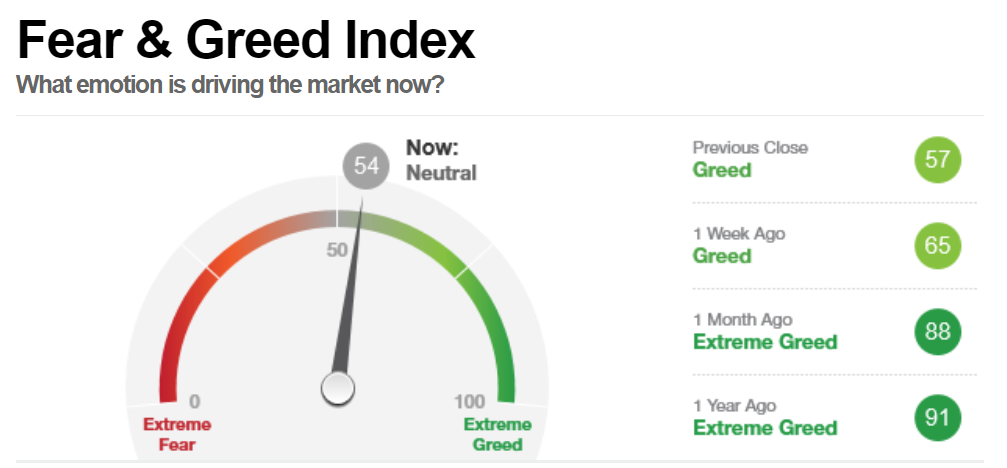
The Fear and Greed Index, developed by CNNMoney, is used to gauge whether investors are too bullish or bearish on the stock market. The index ranges from 0 (extreme fear) to 100 (extreme greed).
Summary
- The Fear and Greed Index is a tool used to gauge investor sentiment on the stock market.
- The index is based on seven different factors – each factor is gauged from 0 to 100 and equally weighted to generate the index value.
- It is seen as less of an investment research tool and more of a market-timing tool.
Understanding the Fear and Greed Index
In theory, the Fear and Greed Index acts as a barometer for whether the stock market is fairly priced by looking at the emotions of investors. It is seen as a contrarian index.
When investors are fearful, they sell stock holdings in their portfolio, driving down stock prices to the point where they may be below their intrinsic valueIntrinsic ValueThe intrinsic value of a business (or any investment security) is the present value of all expected future cash flows, discounted at the appropriate discount rate. Unlike relative forms of valuation that look at comparable companies, intrinsic valuation looks only at the inherent value of a business on its own.. The opposite is true when investors are greedy. As such, for the Index, fear is seen as a buy indicator, and greed is seen as a sell indicator.
A fear and greed rating of:
- 0 to 49 indicates fear
- 50 indicates neutral
- 51 to 100 indicates greed
Calculation of the Fear and Greed Index
The Fear and Greed Index is based on seven different factors – each factor is gauged from 0 to 100 and equally weighted to generate the index value. The seven factors are:
1. Stock Price Strength
The number of stocks on the New York Stock Exchange (NYSE)New York Stock Exchange (NYSE)The New York Stock Exchange (NYSE) is the largest securities exchange in the world, hosting 82% of the S&P 500, as well as 70 of the biggest hitting 52-week highs relative to those hitting 52-week lows. A greater number of stocks hitting 52-week highs versus 52-weeks lows indicates greed and vice versa.
2. Stock Price Breadth
The trading volumes of rising stocks relative to declining stocks on the NYSE. Greater trading volumes in rising stocks versus declining stocks indicate greed and vice versa.
3. Market Momentum
The performance of the S&P 500S&P 500 IndexThe Standard and Poor’s 500 Index, abbreviated as S&P 500 index, is an index comprising the stocks of 500 publicly traded companies in the relative to its 125-day average. A greater relative performance indicates greed and vice versa.
4. Put and Call Options
The Chicago Board Options Exchange put/call ratio. A higher put/call ratio indicates fear and vice versa.
5. Safe Haven Demand
The performance of stocks relative to bonds. Greater relative performance indicates greed and vice versa.
6. Junk Bond Demand
The yield spread between investment-grade bonds and junk bonds. A greater yield spread indicates lower junk bond demand (signals fear) and vice versa.
7. Market Volatility
The Chicago Board Options Exchange (CBOE) Volatility Index (“VIX”)VIXThe Chicago Board Options Exchange (CBOE) created the VIX (CBOE Volatility Index) to measure the 30-day expected volatility of the US stock market, sometimes called the "fear index". The VIX is based on the prices of options on the S&P 500 Index. A higher VIX value indicates fear and vice versa.
Using the Fear and Greed Index
The Fear and Greed Index is commonly used to time entry into the market. As such, the Index is seen as less of an investment research tool and more of a market-timing tool. As stated by Warren Buffet, “Be fearful when others are greedy, and greedy when others are fearful.”
For example, when the index hits a value of 90 (extreme greed), it may signal that stocks are overvalued. It may prompt investors who follow the index to sell their stock holdings.
Practical Examples
Question 1: On September 29, 2008, the Dow closed 778 points down, reflecting a 7% loss. Would you assume that the Fear and Greed Index took on a value of (a) 20, (b) 60, or (c) 90 on that day?
Answer 1: The Index likely assumed a value of 20 on that day, as the steep decline would likely reflect fear by investors.
Question 2: Tim is looking to invest in the stock market. Despite his investment advisor advising him not to time the market, Tim thinks otherwise. Based solely on the Fear and Greed Index, which is currently at 95, is it likely that Tim will deploy his capital today?
Answer 2: Since Tim is looking to time entry into the market, he would likely be looking for a low Fear and Greed Index before deploying his capital. As such, given a value of 95 (extreme greed), it is unlikely that Tim will deploy his capital today.
More Resources
CFI is the official provider of the global Capital Markets & Securities Analyst (CMSA)™Program Page - CMSAEnroll in CFI's CMSA® program and become a certified Capital Markets &Securities Analyst. Advance your career with our certification programs and courses. certification program, designed to help anyone become a world-class financial analyst. To keep advancing your career, the additional CFI resources below will be useful:
- ContrarianContrarianA contrarian is an individual who acts in opposition to the majority. In terms of investing, a contrarian investor is someone who trades against prevailing market sentiments. When the market buys, they sell, and vice-versa.
- Junk BondsJunk BondsJunk Bonds, also known as high-yield bonds, are bonds that are rated below investment grade by the big three rating agencies (see image below). Junk bonds carry a higher risk of default than other bonds, but they pay higher returns to make them attractive to investors.
- Options: Calls and PutsOptions: Calls and PutsAn option is a derivative contract that gives the holder the right, but not the obligation, to buy or sell an asset by a certain date at a specified price.
- Volume of TradeVolume of TradeVolume of trade, also known as trading volume, refers to the quantity of shares or contracts that belong to a given security traded on a daily basis
-

Hang Seng Index (HSI): A Comprehensive Guide to Hong Kong's Stock Market
The Hang Seng Index (HSI) is a stock market index in Hong Kong. It records and monitors the daily changes in stock prices of the 50 largest Hong Kong stock market companies. As the companies represent
-
Herrick Payoff Index: Understanding Derivative Market Trends
The Herrick Payoff Index is a forward-looking technical analysis tool used to identify trends in derivative markets. Using price, volume, and open interest, the index provides an overview of money flo
invest
- Advance-Decline Line: Understanding Market Sentiment & Trends
- EAFE Index: Understanding Developed Market Performance
- Nikkei Index: Understanding Japan's Top Stock Market Indicator
- Price-Weighted Index Explained: How It Works & Examples
- Understanding the S&P 500: Top Holdings & Long-Term Performance
- ETFs vs. Index Funds: A Comprehensive Comparison for Investors
- Bitcoin Fear & Greed Index: Understanding Market Sentiment
- Crypto Fear & Greed Index: Understanding Market Sentiment
- Fear & Greed Index: Understanding Market Sentiment & Trading Signals
-
 Capitalization-Weighted Index (CWI): Explained
The Capitalization-Weighted Index (cap-weighted index, CWI) is a type of stock market index in which each component of the index is weighted relative to its total market capitalizationMarket Capitaliz...
-
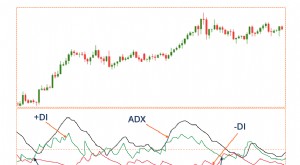 DMI: Understanding the Directional Movement Index for Trading
The Directional Movement Index (DMI) is an indicator that helps in determining the direction the asset price is moving and the strength of the price movement. It does so by comparing the current price...