Covariance Explained: Understanding Relationships in Finance
In mathematics and statisticsBasic Statistics Concepts for FinanceA solid understanding of statistics is crucially important in helping us better understand finance. Moreover, statistics concepts can help investors monitor, covariance is a measure of the relationship between two random variables. The metric evaluates how much – to what extent – the variables change together. In other words, it is essentially a measure of the variance between two variables. However, the metric does not assess the dependency between variables.

Unlike the correlation coefficient, covariance is measured in units. The units are computed by multiplying the units of the two variables. The variance can take any positive or negative values. The values are interpreted as follows:
- Positive covariance: Indicates that two variables tend to move in the same direction.
- Negative covariance: Reveals that two variables tend to move in inverse directions.
In financeFinanceCFI's Finance Articles are designed as self-study guides to learn important finance concepts online at your own pace. Browse hundreds of articles!, the concept is primarily used in portfolio theory. One of its most common applications in portfolio theory is the diversificationDiversificationDiversification is a technique of allocating portfolio resources or capital to a variety of investments.The goal of diversification is to mitigate losses method, using the covariance between assets in a portfolio. By choosing assets that do not exhibit a high positive covariance with each other, the unsystematic risk can be partially eliminated.
CFI’s Math for Corporate Finance Course explores the financial mathematics concepts required for Financial Modeling.What is Financial ModelingFinancial modeling is performed in Excel to forecast a company's financial performance. Overview of what is financial modeling, how & why to build a model.
Formula for Covariance
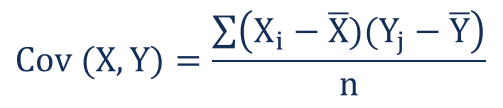
The covariance formula is similar to the formula for correlation and deals with the calculation of data points from the average value in a dataset. For example, the covariance between two random variables X and Y can be calculated using the following formula (for population):
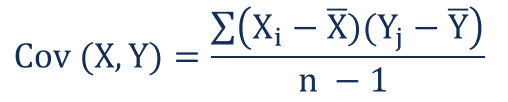
For a sample covariance, the formula is slightly adjusted:
Where:
- Xi – the values of the X-variable
- Yj – the values of the Y-variable
- X̄ – the mean (average) of the X-variable
- Ȳ – the mean (average) of the Y-variable
- n – the number of data points
Covariance vs. Correlation
Covariance and correlation both primarily assess the relationship between variables. The closest analogy to the relationship between them is the relationship between the variance and standard deviationStandard DeviationFrom a statistics standpoint, the standard deviation of a data set is a measure of the magnitude of deviations between values of the observations contained.
Covariance measures the total variation of two random variables from their expected values. Using covariance, we can only gauge the direction of the relationship (whether the variables tend to move in tandem or show an inverse relationship). However, it does not indicate the strength of the relationship, nor the dependency between the variables.
On the other hand, correlation measures the strength of the relationship between variables. Correlation is the scaled measure of covariance. It is dimensionless. In other words, the correlation coefficient is always a pure value and not measured in any units.
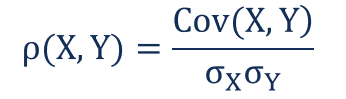
The relationship between the two concepts can be expressed using the formula below:
Where:
- ρ(X,Y) – the correlation between the variables X and Y
- Cov(X,Y) – the covariance between the variables X and Y
- σX – the standard deviation of the X-variable
- σY – the standard deviation of the Y-variable
Example of Covariance
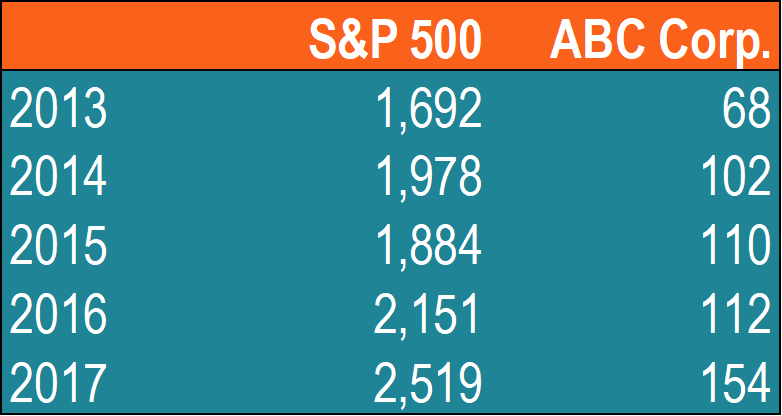
John is an investor. His portfolio primarily tracks the performance of the S&P 500 and John wants to add the stock of ABC Corp. Before adding the stock to his portfolio, he wants to assess the directional relationship between the stock and the S&P 500.
John does not want to increase the unsystematic risk of his portfolio. Thus, he is not interested in owning securities in the portfolio that tend to move in the same direction.
John can calculate the covariance between the stock of ABC Corp. and S&P 500 by following the steps below:
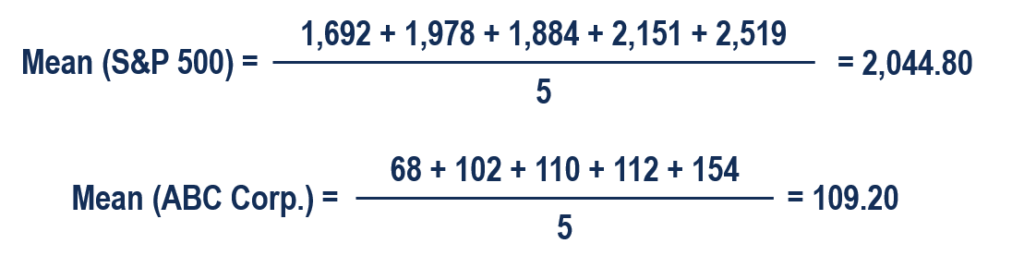
1. Obtain the data.
First, John obtains the figures for both ABC Corp. stock and the S&P 500. The prices obtained are summarized in the table below:
2. Calculate the mean (average) prices for each asset.
3. For each security, find the difference between each value and mean price.
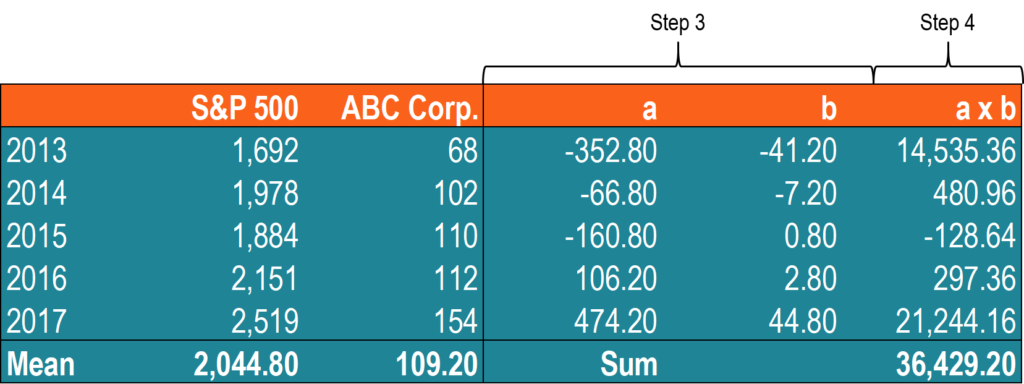
4. Multiply the results obtained in the previous step.
5. Using the number calculated in step 4, find the covariance.

In such a case, the positive covariance indicates that the price of the stock and the S&P 500 tend to move in the same direction.
Additional Resources
CFI offers the Financial Modeling & Valuation Analyst (FMVA)™Become a Certified Financial Modeling & Valuation Analyst (FMVA)®CFI's Financial Modeling and Valuation Analyst (FMVA)® certification will help you gain the confidence you need in your finance career. Enroll today! certification program for those looking to take their careers to the next level. To keep learning and advancing your career, the following CFI resources will be helpful:
- Investing: A Beginner’s GuideInvesting: A Beginner's GuideCFI's Investing for Beginners guide will teach you the basics of investing and how to get started. Learn about different strategies and techniques for trading
- Negative CorrelationNegative CorrelationA negative correlation is a relationship between two variables that move in opposite directions. In other words, when variable A increases, variable B decreases. A negative correlation is also known as an inverse correlation. See examples, charts and
- Risk and ReturnRisk and ReturnIn investing, risk and return are highly correlated. Increased potential returns on investment usually go hand-in-hand with increased risk. Different types of risks include project-specific risk, industry-specific risk, competitive risk, international risk, and market risk.
- Risk ManagementRisk ManagementRisk management encompasses the identification, analysis, and response to risk factors that form part of the life of a business. It is usually done with
-
Annuity Due Explained: Payments at the Beginning of Each Period
Annuity due refers to a series of equal payments made at the same interval at the beginning of each period. Periods can be monthly, quarterly, semi-annually, annually, or any other defined period. Exa
-

Understanding Appropriation Accounts: Distribution of Funds & Profits
An appropriation account shows how an organization’s funds are distributed among partners, shareholders, and departments. For companies, an appropriation account shows how the company’s pr
finance
- PC Banking: A Comprehensive Guide to Online Banking Security & Features
- IRA CDs: Secure Retirement Savings with FDIC Insurance
- Understanding the DU: Your Mortgage Approval Explained
- Decentralized Finance (DeFi): A Comprehensive Overview
- Understanding Correlation: A Statistical Guide
- Jumbo CDs: Higher Rates & Deposits Explained
- Understanding Cryptocurrency: A Beginner's Guide to Digital Currency
- Understanding Regulation Z: Your Rights as a Borrower
- Annuities Explained: A Simple Guide to Retirement Income
-
 Understanding Add-On Interest: How It Works & Loan Payments
Add-on interest refers to the calculation method of determining the total interest to be paid on a loan. Once the interest’s been added to the principal, the amount is divided by the number of m...
-
 Understanding Alpha: A Guide to Investment Performance
Alpha is a measure of the performance of an investment as compared to a suitable benchmark index, such as the S&P 500S&P – Standard and PoorsStandard & Poor’s is an American fi...