High-Low Method vs. Regression Analysis: Revenue Forecasting Explained
The high low method and regression analysisForecasting MethodsTop Forecasting Methods. In this article, we will explain four types of revenue forecasting methods that financial analysts use to predict future revenues. are the two main cost estimation methods used to estimate the amounts of fixed and variable costsFixed and Variable CostsCost is something that can be classified in several ways depending on its nature. One of the most popular methods is classification according. Usually, managers must break mixed costs into their fixed and variable components to predict and plan for the future.
Learn more in CFI’s Math for Corporate Finance Course.
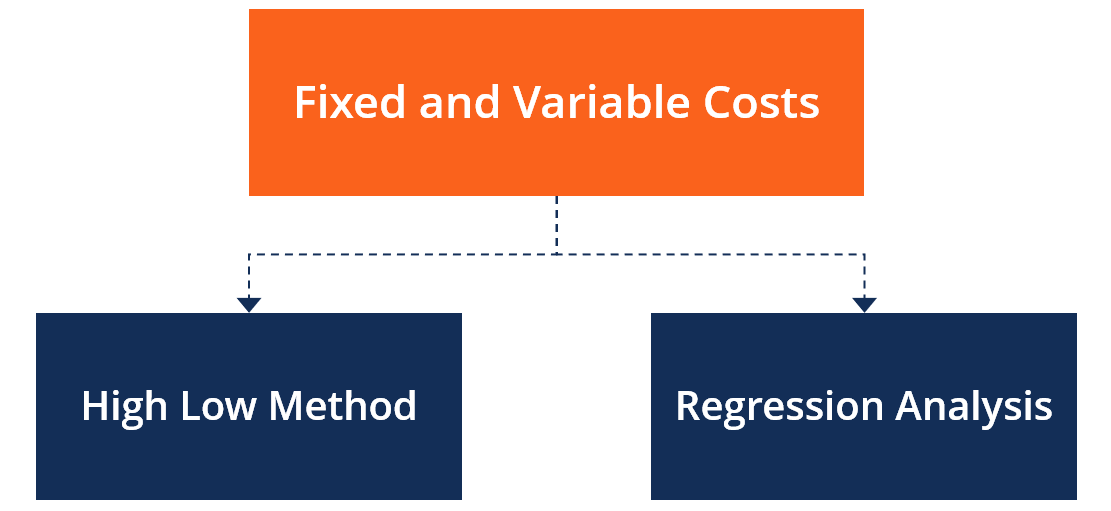
The high low method uses a small amount of data to separate fixed and variable costs. It takes the highest and lowest activity levels and compares their total costs. On the other hand, regression analysis shows the relationship between two or more variables. It is used to observe changes in the dependent variableDependent VariableA dependent variable is a variable whose value will change depending on the value of another variable, called the independent variable. relative to changes in the independent variableIndependent VariableAn independent variable is an input, assumption, or driver that is changed in order to assess its impact on a dependent variable (the outcome)..
High Low Method
The high low method determines the fixed and variable components of a cost. It can be applied in discerning the fixed and variable elements of the cost of a productCost of Goods Manufactured (COGM)Cost of Goods Manufactured (COGM) is a term used in managerial accounting that refers to a schedule or statement that shows the total, machine, store, geographic sales region, product line, etc.
For example, in the production cost of a product, fixed costs may comprise employee’s wages and rental expenses, whereas variable costs include costs incurred in purchasing raw materials.
Formula
The high low method splits the variable and fixed components of mixed costs. The formulas for each component are as follows:
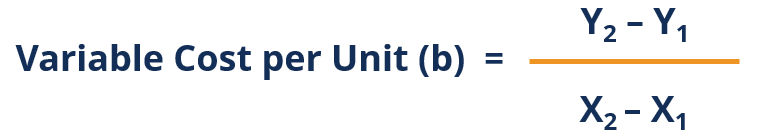
Where:
Y2 is the cost at the highest activity level
Y1 is the cost at the lowest activity level
X2 is the number of units at the highest activity level
X1 is the number of units at the lowest activity level
Once the variable cost has been calculated, the fixed cost can be derived by subtracting the total variable cost from the total cost. This is represented by the following formula:
Fixed Cost = Y2 – bX2
or
Fixed Cost = Y1 – bX1
Where:
b is the variable cost
Example
Company ABC is a manufacturer of pharmaceuticals. The company wants to estimate the amount of overhead costs that it will incur in April, given that the company plans to make 8,000 units in that month. Following are the figures from January to March:
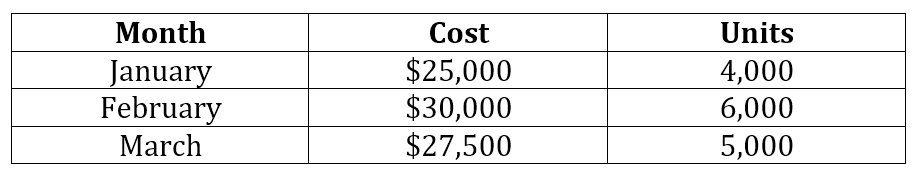
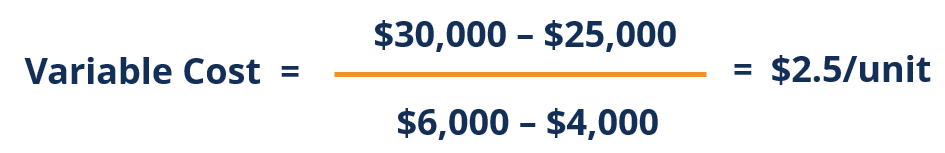
Using the variable cost formula above, where:
Y2 = $30,000
Y1 = $25,000
X2 = 6,000
X1 = 4,000
Therefore:
Fixed Cost = $30,000 – (2.5 x $6,000) = $15,000
or
Fixed Cost = $25,000 – (2.5 x $4,000) = $15,000
Projected variable cost for the month of April is calculated as follows:
= 2.5 x $8,000
= $20,000
Total cost = Fixed cost + Variable cost
= $15,000 + $20,000
= $35,000
Learn more in CFI’s Math for Corporate Finance Course.
Advantages of High Low Method
Using the high low method offers the following benefits:
Easy to use
The high-low method only requires the cost and unit information at the highest and lowest activity level to get the required information. Managers can implement this technique with ease since it does not require any special tools.
High accuracy with stable costs
The high low method can be relatively accurate if the highest and lowest activity levels are representative of the overall cost behavior of the company. However, if the two extreme activity levels are systematically different, then the high low method will produce inaccurate results.
Disadvantages of High Low Method
The high low method comes with the following disadvantages:
May be Unreliable
The method does not represent all the data provided since it relies on just two extreme activity levels. Those activity levels may not be representative of the costs incurred, due to outlier costs that are higher or lower than what the organization incurs in other activity levels.
Does not account for inflation
The high low method excludes the effects of inflationInflationInflation is an economic concept that refers to increases in the price level of goods over a set period of time. The rise in the price level signifies that the currency in a given economy loses purchasing power (i.e., less can be bought with the same amount of money). when estimating costs.
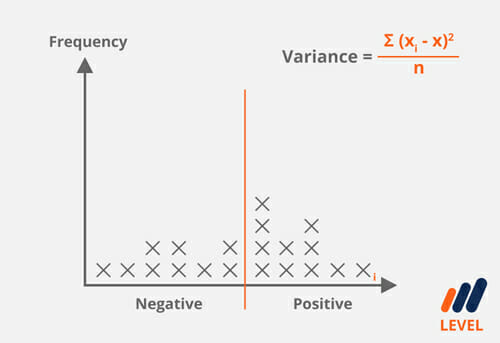
Regression Analysis
In contrast to the High Low Method, Regression analysis refers to a technique for estimating the relationship between variables. It helps people understand how the value of a dependent variable changes when one independent variable is variable while another is held constant. Regression analysis is used in forecasting future data. The two main types of regression analysis are linear regression and multiple regression.
Linear regression
Linear regression is a method that studies the relationship between continuous variables. The variables are plotted on a straight line. The linear regression can be calculated using the following formula:
Y = a + bX + ⋴
Where:
Y is the dependent variable
X is the independent variable
b is the slope of the regression line
a is the intercept of the regression line
⋴ is the regression residual
From the formula above, we can deduce that the value of Y is dependent on the value of X, while the value of b shows the changes in Y every time the value of X changes. Meaning, if b equals 0.5, it means that every time X increases or increases by a specific value, the value of Y increases or decreases by that value. On the other hand, when X=0, the value of “a” equals the value of Y.
Assumptions of Linear Regression
- The relationship between dependent variable Y and independent variable X is linear in the slope and intercept ‘a’ and ‘b,’ respectively.
- Independent variable X is not random.
- The value of the error term ⋴ is 0 and is constant for all observations.
Multiple Regression
Multiple regression is a statistical technique that predicts the value of one variable using the value of two or more independent variables. Once each of the independent variables has been determined, they can be used to predict the amount of effect that the independent variables have on the dependent variable. The effect is represented on a straight line to approximate each of the data points.
Learn more in CFI’s Math for Corporate Finance Course.
Formula
The formula for multiple regression is as follows:
Y1= B0 + B1x1 + b2x2+ ………..bnxn + ⋴
Where:
Y1 is the predicted value of the dependent variable
B0 is the intercept
B1, b2 … bn are the regression coefficient
x1, x2, …… xn are the independent variables
⋴ is the regression residual
Assumptions of Multiple Regression
- There is a linear relationship between dependent and independent variables.
- Y1 observations are selected independently and randomly from the population.
- Independent variables are not highly correlated with each other.
- The regression residual shows a mean of 0 and variance of 0.
Related Readings
Thank you for reading CFI’s comparison of the High Low Method and Regression Analysis. CFI offers the Financial Modeling & Valuation Analyst (FMVA)™Become a Certified Financial Modeling & Valuation Analyst (FMVA)®CFI's Financial Modeling and Valuation Analyst (FMVA)® certification will help you gain the confidence you need in your finance career. Enroll today! certification program for those looking to take their careers to the next level. To keep learning and advancing your career, the following CFI resources will be helpful:
- Cost StructureCost StructureCost structure refers to the types of expenses that a business incurs, and is typically composed of fixed and variable costs. Fixed costs remain unchanged
- Homogeneous Cost PoolHomogeneous Cost PoolA homogeneous cost pool is essentially an accounting term used by the management of a company to group together costs that show a similar cause and effect, or benefits received, relationship in terms of the allocation base of costs. In short, homogeneous cost pools are a way of logically grouping together related
- Projecting Income Statement Line ItemsProjecting Income Statement Line ItemsWe discuss the different methods of projecting income statement line items. Projecting income statement line items begins with sales revenue, then cost
- Variable CostingVariable CostingVariable costing is a concept used in managerial and cost accounting in which the fixed manufacturing overhead is incurred in the period that
-

Average Cost Inventory Valuation: A Simple Guide
The average cost inventory valuation method is one way that many companies choose to evaluate their company inventory. This method is very simple to calculate and is preferred by many companies
-
Understanding 52-Week Highs & Lows: A Stock Analysis Guide
The 52-week high/low is a commonly used indicator in stock trading. Here are the basics of the 52-week high/low and why some investors utilize it when analyzing stocks. The 52-Week High/Low
finance
- Understanding 52-Week Highs & Lows: A Key Stock Indicator
- CVP Analysis: Understand Break-Even & Profitability
- Incremental Analysis: A Comprehensive Guide for Business Decisions
- Life Cycle Cost Analysis (LCCA): A Comprehensive Guide
- Regression Analysis: A Comprehensive Guide to Understanding Relationships
- Cost Behavior Analysis: Understanding Cost Relationships & Management
- Cost Recovery Method: Understanding Revenue Recognition
- Variable Costs Explained: Definition, Examples & Impact
- High-Low Method: Cost Accounting Explained
-
 High-Low Method: Understanding & Application in Cost Accounting
In cost accounting, the high-low method is a technique used to split mixed costs into fixed and variable costsFixed and Variable CostsCost is something that can be classified in several ways depending...
-
Understanding Low-Cost Brokers: A Beginner's Guide
A low-cost broker is a type of investment broker that charges a lower amount of commission than most traditional brokers. These low-cost brokers are becoming more popular in the industry today a...