Regression Analysis: A Comprehensive Guide to Understanding Relationships
Regression analysis is a set of statistical methods used for the estimation of relationships between a dependent variable and one or more independent variablesIndependent VariableAn independent variable is an input, assumption, or driver that is changed in order to assess its impact on a dependent variable (the outcome).. It can be utilized to assess the strength of the relationship between variables and for modeling the future relationship between them.
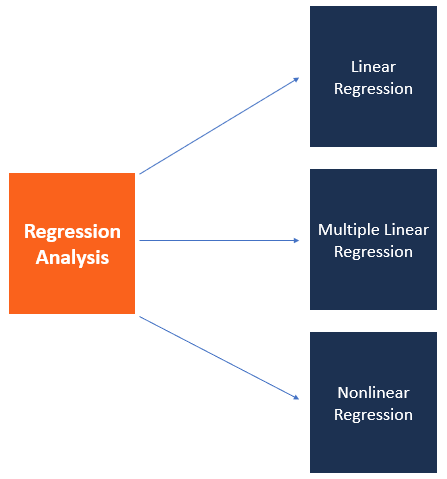
Regression analysis includes several variations, such as linear, multiple linear, and nonlinear. The most common models are simple linear and multiple linear. Nonlinear regression analysis is commonly used for more complicated data sets in which the dependent and independent variables show a nonlinear relationship.
Regression analysis offers numerous applications in various disciplines, including finance.
Regression Analysis – Linear Model Assumptions
Linear regression analysis is based on six fundamental assumptions:
- The dependent and independent variables show a linear relationship between the slope and the intercept.
- The independent variable is not random.
- The value of the residual (error) is zero.
- The value of the residual (error) is constant across all observations.
- The value of the residual (error) is not correlated across all observations.
- The residual (error) values follow the normal distribution.
Regression Analysis – Simple Linear Regression
Simple linear regression is a model that assesses the relationship between a dependent variable and an independent variable. The simple linear model is expressed using the following equation:
Y = a + bX + ϵ
Where:
- Y – Dependent variable
- X – Independent (explanatory) variable
- a – Intercept
- b – Slope
- ϵ – Residual (error)
Regression Analysis – Multiple Linear Regression
Multiple linear regression analysis is essentially similar to the simple linear model, with the exception that multiple independent variables are used in the model. The mathematical representation of multiple linear regression is:
Y = a + bX1 + cX2 + dX3 + ϵ
Where:
- Y – Dependent variable
- X1, X2, X3 – Independent (explanatory) variables
- a – Intercept
- b, c, d – Slopes
- ϵ – Residual (error)
Multiple linear regression follows the same conditions as the simple linear model. However, since there are several independent variables in multiple linear analysis, there is another mandatory condition for the model:
- Non-collinearity: Independent variables should show a minimum correlation with each other. If the independent variables are highly correlated with each other, it will be difficult to assess the true relationships between the dependent and independent variables.
Regression Analysis in Finance
Regression analysis comes with several applications in finance. For example, the statistical method is fundamental to the Capital Asset Pricing Model (CAPM)Capital Asset Pricing Model (CAPM)The Capital Asset Pricing Model (CAPM) is a model that describes the relationship between expected return and risk of a security. CAPM formula shows the return of a security is equal to the risk-free return plus a risk premium, based on the beta of that security. Essentially, the CAPM equation is a model that determines the relationship between the expected return of an asset and the market risk premium.
The analysis is also used to forecast the returns of securities, based on different factors, or to forecast the performance of a business. Learn more forecasting methods in CFI’s Budgeting and Forecasting Course!
1. Beta and CAPM
In finance, regression analysis is used to calculate the BetaBetaThe beta (β) of an investment security (i.e. a stock) is a measurement of its volatility of returns relative to the entire market. It is used as a measure of risk and is an integral part of the Capital Asset Pricing Model (CAPM). A company with a higher beta has greater risk and also greater expected returns. (volatility of returns relative to the overall market) for a stock. It can be done in Excel using the Slope functionSLOPE FunctionThe SLOPE Function is categorized under Excel Statistical functions. It will return the slope of the linear regression line through the data points in known_y's and known_x's. In financial analysis, SLOPE can be useful in calculating beta for a stock. Formula = LOPE(known_y's, known_x's) The function uses the.
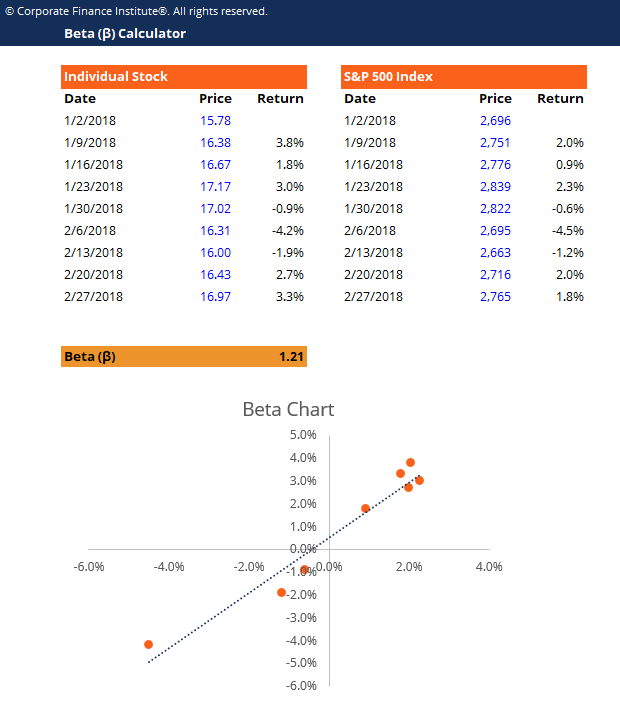
Download CFI’s free beta calculatorBeta CalculatorThis beta calculator allows you to measure the volatility of returns of an individual stock relative to the entire market. The beta (β) of an investment security (i.e. a stock) is a measurement of its volatility of returns relative to the entire market. It is used as a measure of risk and is an integral part of the Cap!
2. Forecasting Revenues and Expenses
When forecasting financial statementsFinancial ForecastingFinancial forecasting is the process of estimating or predicting how a business will perform in the future. This guide on how to build a financial forecast for a company, it may be useful to do a multiple regression analysis to determine how changes in certain assumptions or drivers of the business will impact revenue or expenses in the future. For example, there may be a very high correlation between the number of salespeople employed by a company, the number of stores they operate, and the revenue the business generates.
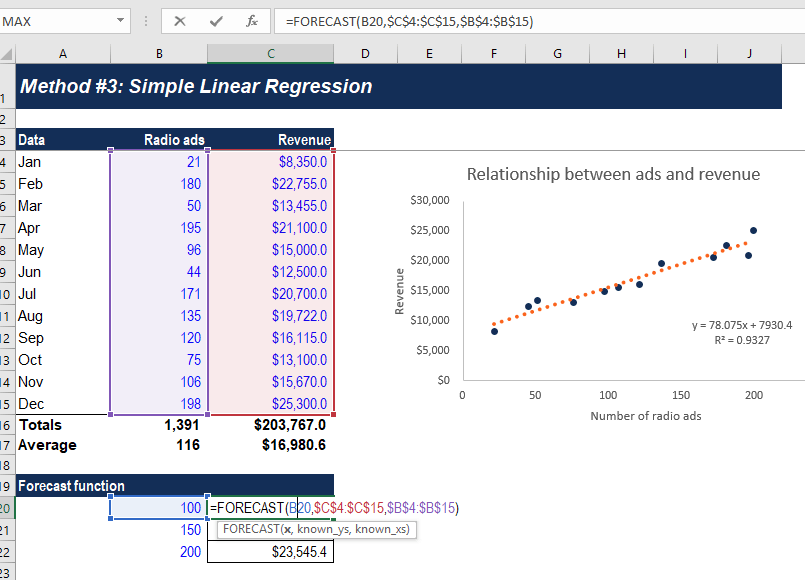
The above example shows how to use the Forecast functionFORECAST FunctionThe FORECAST Function is categorized under Excel Statistical functions. It will calculate or predict for us a future value using existing values. In financial modeling, the forecast function can be useful in calculating the statistical value of a forecast made. For example, if we know the past earnings and in Excel to calculate a company’s revenue, based on the number of ads it runs.
Learn more forecasting methods in CFI’s Budgeting and Forecasting Course!
Regression Tools
Excel remains a popular tool to conduct basic regression analysis in finance, however, there are many more advanced statistical tools that can be used.
Python and R are both powerful coding languages that have become popular for all types of financial modeling, including regression. These techniques form a core part of data science and machine learning where models are trained to detect these relationships in data.
Learn more about regression analysis, Python, and Machine Learning in CFI’s Business Intelligence & Data Analysis certification.
Additional Resources
To learn more about related topics, check out the following free CFI resources:
- Cost Behavior AnalysisCost Behavior AnalysisCost behavior analysis refers to management’s attempt to understand how operating costs change in relation to a change in an organization’s
- Financial Modeling SkillsFinancial Modeling SkillsLearn the 10 most important financial modeling skills and what's required to be good at financial modeling in Excel. Most important skills: accounting
- Forecasting MethodsForecasting MethodsTop Forecasting Methods. In this article, we will explain four types of revenue forecasting methods that financial analysts use to predict future revenues.
- High-Low MethodHigh-Low MethodIn cost accounting, the high-low method is a technique used to split mixed costs into variable and fixed costs. Although the high-low method
-

Volume Analysis: A Comprehensive Guide for Traders & Investors
Volume analysis refers to the examination of the total number of securities transacted within a given time period. They can be shares or contracts of any given security. Technical analysts consider tr
-

Customer Profitability Analysis: Understanding & Calculating
Customer Profitability Analysis is a tool from managerial accounting that shifts the focus from product line profitabilityCost of Goods Manufactured (COGM)Cost of Goods Manufactured (COGM) is a term u
finance
- Contribution Analysis: Understanding Profitability & Cost Management
- Credit Analysis: A Comprehensive Guide to Assessing Credit Risk
- Quantitative Analysis: Definition, Methods & Applications
- Financial Analysis: A Comprehensive Guide for Professionals
- Fundamental Analysis: A Comprehensive Guide to Investment Valuation
- Horizon Analysis: Predicting Portfolio Returns & Investment Strategies
- Industry Analysis: A Comprehensive Guide for Business Insights
- Pareto Analysis: The 80/20 Rule Explained | [Your Brand/Website Name]
- Top-Down Analysis: A Comprehensive Guide for Investors
-
 Time Series Data Analysis: A Comprehensive Overview
Time series data analysis is the analysis of datasets that change over a period of time. Time series datasets record observations of the same variableIndependent VariableAn independent variable is an ...
-
 Stock Analysis: A Comprehensive Guide for Investors
Stock analysis refers to the method that an investor or trader uses to evaluate and investigate a particular trading instrument, investment sector, or the stock market as a whole. Stock analysis is al...