Money Flow Index (MFI): A Comprehensive Guide for Traders
Money Flow Index (MFI) is a movement indicator that analyzes both time and price to measure the trading pressure – buying or selling. It is also called volume-weighted Relative Strength Index (RSI), as it includes volume, unlike RSI, which only incorporates price.

Positive money flow is indicated by an increase in typical price, signaling buying pressure, whereas a decrease in typical price indicates a negative money flow, thus signaling a selling pressureBullish and BearishProfessionals in corporate finance regularly refer to markets as being bullish and bearish based on positive or negative price movements. A bear market is typically considered to exist when there has been a price decline of 20% or more from the peak, and a bull market is considered to be a 20% recovery from a market bottom.. These positive and negative money flows are accumulated to create a money flow ratio or money ratio.
The money ratio is used to find out the MFI that oscillates between 0 and 100. As the MFI incorporates volume, it can be used for the identification of price extremes and reversals with diverse signals.
Summary
- Money Flow Index (MFI) is an indicator that measures the selling and buying pressure by analyzing price and volume data.
- The MFI indicator swings between 0 and 100.
- The overbought condition occurs when the MFI rises above 80. An MFI below 20 indicates an oversold condition.
Formula for the Money Flow Index (MFI)
Money Flow Index (MFI) can be calculated using the following steps:
1. Compute the typical price for a period.
Typical Price = (Low + High + Close) / 3
If the typical price for today is higher than yesterday, it implies a positive money flow. If the typical price is lower, it implies a negative money flow. The aggregate of positive money over certain periods gives positive money flow, and the aggregate of negative money over certain periods gives negative money flow.
2. Compute the raw money flow.
Raw Money Flow = Volume x Typical Price
3. Compute the money ratio.
Money Ratio = 14-period Positive Money Flow / 14-period Negative Money Flow
4. Compute the Money Flow Index (MFI).
Money Flow Index (MFI) = 100 – [100 / (1 + Money Ratio)]
Money Flow Index (MFI) Signals
MFI generates three main signals – overbought/oversold conditions, failure swings, and divergences.
1. Overbought/Oversold condition
A security will be considered overbought if the MFI shows a fast price rise to a high level. Similarly, a security is considered oversold if the MFI indicates a rapid decline in the price to a considerably low level. The oversold and overbought levels are helpful in the identification of price extremes.
Generally, overbought conditions occur if the MFI is above 80, and below 20 MFI indicates oversold conditions. The prices may continue to rise while the upward trend is strong, and the MFI can increase beyond 80.
On the other hand, MFI can drop below 20 when the prices continue to fall in the presence of a strong downward trend. If the MFI increases above 90, it is considered a truly overbought condition, and a below 10 MFI is considered a truly oversold condition.
However, the MFI beyond 90 and less than 10 occur rarely and suggest that a price movement is not sustainable. Many securities trade in the exchange marketNew York Stock Exchange (NYSE)The New York Stock Exchange (NYSE) is the largest securities exchange in the world, hosting 82% of the S&P 500, as well as 70 of the biggest without reaching the price extremes of the 90/10 level.
2. Divergences
Divergence signals occur if the indications from the price action and the MFI are the opposite. The difference in the indications can be regarded as an upcoming reversal. Specifically, there are two types of divergences:
Bullish Money Flow Index (MFI) divergence
It occurs when the price changes to a new low, whereas, the MFI indicates a higher low showing a boost in money flow. It implies that the selling pressure is decreasing, and buyers will be taking over the market. It presents an opportunity of buying the securities at low prices.
Bearish Money Flow Index (MFI) divergence
It occurs when the price shifts to a new high while the MFI indicates a lower high. It signifies the decrease in buying pressure and the time for sellers to take over the market. It is an opportunity for sellers to make profitsProfit vs CashUnderstanding the difference between profit vs cash is very important in the finance industry. Profit is defined as revenue less all the expenses of a.
3. Failure swings
Like divergences, failure swings can also result in a reversal in price. However, failure swings do not depend on price and completely rely on the MFI. There are four steps in failure swings in both types of failure swings – bullish and bearish.
Bullish Money Flow Index (MFI) failure swing
Step 1: MFI decreases below 20 (oversold)
Step 2: MFI recovers and rises above 20
Step 3: MFI decreases but stays above 20
Step 4: MFI shoots above the previous high
Bearish Money Flow Index (MFI) failure swing
Step 1: MFI increases above 80 (overbought)
Step 2: MFI drops below 80
Step 3: MFI slightly increases but stays below 80
Step 4: MFI drops below the previous low
Related Readings
CFI is the official provider of the global Commercial Banking & Credit Analyst (CBCA)™Program Page - CBCAGet CFI's CBCA™ certification and become a Commercial Banking & Credit Analyst. Enroll and advance your career with our certification programs and courses. certification program, designed to help anyone become a world-class financial analyst. To keep advancing your career, the additional CFI resources below will be useful:
- Volume Weighted Adjusted Price (VWAP)Volume Weighted Adjusted Price (VWAP)The Volume Weighted Average Price (VWAP) is, as the name suggests, is the average price of a stock weighted by the total trading volume. The VWAP is used to
- Average Selling Price (ASP)Average Selling Price (ASP)The average selling price (ASP) is a term that refers to the price that a good or service is sold for. The ASP can be used as a benchmark by businesses
- Bullish and BearishBullish and BearishProfessionals in corporate finance regularly refer to markets as being bullish and bearish based on positive or negative price movements. A bear market is typically considered to exist when there has been a price decline of 20% or more from the peak, and a bull market is considered to be a 20% recovery from a market bottom.
- Relative Strength Index (RSI)Relative Strength Index (RSI)The Relative Strength Index (RSI) is one of the most popular and widely used momentum oscillators. It was originally developed by the famed mechanical engineer turned technical analyst, J. Welles Wilder. The RSI measures both the speed and rate of change in price
-

Understanding Index Options: A Comprehensive Guide
An index option is a financial derivative contract whose value is derived from an underlying stock market index. It gives the holder the right (but not the obligation) to buy or sell the underlying in
-

Understanding Indexing: A Passive Investment Strategy
Indexing is a passive investment strategy where you construct a portfolioInvestment PortfolioAn investment portfolio is a set of financial assets owned by an investor that may include bonds, stocks, c
invest
- Chaikin Money Flow (CMF): Understanding Stock Accumulation & Distribution
- High-Low Index: Understanding 52-Week Highs & Lows | [Your Brand]
- Understanding Hot Money Investments: Strategies & Capital Gains Yield
- Index Investing: A Beginner's Guide to Passive Investing
- Understanding Market Indexes: A Comprehensive Guide
- Understanding Money Flow: A Guide for Traders
- Understanding Smart Money: Definition & Strategies
- Stock Indexes Explained: A Beginner's Guide to Market Benchmarks
- Composite Indexes: Understanding Financial Benchmarks & Their Use
-
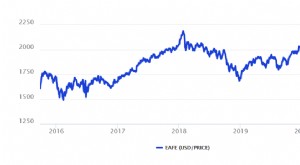 EAFE Index: Understanding Developed Market Performance
The EAFE Index (Europe, Australasia, and the Far East) was created to measure the performance of the stock markets in developed markets – excluding the U.S. and Canada. The indicator is maintain...
-
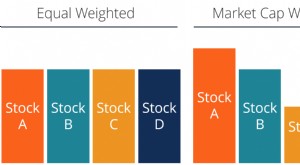 Equal-Weighted Index Explained: Benefits & How It Works
An equal-weighted index is a stock market index – comprised of a group of publicly traded companiesPrivate vs Public CompanyThe main difference between a private vs public company is that the sh...