Understanding Money Flow: A Guide for Traders
Money flow is a technical indicator used to assess the future movement of prices based on demand and supplySupply and DemandThe laws of supply and demand are microeconomic concepts that state that in efficient markets, the quantity supplied of a good and quantity. It is used to construct the difference between uptick and downtick dollar trading volume. Money flow, whether flowing in or out, indicates the current excess supply or demand.
Traders determine whether the money flow was positive or negative for the present day by comparing the present value of money flow with previous money flow. Assuming that uptick traders are buyer-motivated and downtick traders are seller-motivated, a positive difference between the uptick dollar volume and the downtick dollar volume is equivalent to excess demand.
Summary
- Money flow is a mathematical function used by investors to predict cross-sectional variation in future returns.
- Chaikin money flow oscillator is a common money flow indicator used by traders to make investment decisions.
- From a global perspective, money flows help to understand the risks and rewards associated with global equity investing.
Understanding Money Flow
When a trade occurs at a higher price than the previous trade, the difference is considered a positive money flow. On the other hand, negative money flow takes place when the next purchases are at a lower price than the former. When the stock is purchased at the same price as the previous stock, the trade does not contribute to money flow.
Money flow can also be determined based on the trade volumesVolume of TradeVolume of trade, also known as trading volume, refers to the quantity of shares or contracts that belong to a given security traded on a daily basis multiplied by transaction price (dollar volume), where money flow is considered positive if the trade occurred on an uptick and negative when the next trade is purchased on a downtick. Positive money flow occurs if investors were willing to pay premiums for the stock, meaning that more shares were purchased on that day on an uptick than a downtick.
A pending price reversal occurs if negative money flow occurs when stock prices are rising. Investors rely on money flow as an indicator of future returns. It is based on the premise that trading volume is habitually considered to lead price; hence, it identifies early trading opportunities.
How to Determine Money Flow
Money flow is calculated by finding the average of the closing, low, and high prices, and multiplying the result by the daily volume. Consider the example below in which money flow is negative between the first day and the second day.
Day 1Day 2High: $85High: $87Low: $80Low: $77Closing: $84Closing: $86Daily Volume: 400,000 sharesDaily Closing: 200,000 sharesMoney Flow = 400,000 × 83 = $33,200,000Money Flow = 200,000 × 83 = $16,600,000
The above example shows a negative money flow between Day 1 and Day 2.
Money Flow and Money Flow Indicators
Chaikin money flow oscillator is commonly used by traders to make sharper entry and exit point decisions. The indicator was developed by Marc Chaikin and used both volume and closing price to give a clear picture of the price movements.
As with other money flow indicators, Chaikin money flow oscillator produces values for purchasing and selling pressure. However, what makes the indicator stands out is that it also determines momentum by using two exponential moving averages. The concept is similar to the Moving Average Convergence (MACD)MACD Oscillator - Technical AnalysisThe MACD Oscillator is used to examine short-term moving average convergence and divergence. The MACD Oscillator is a double-edged technical indicator in that it offers traders and analysts the ability to follow trends in the market, as well as gauge the momentum of price changes. used by other indicators to assess momentum.
The Money Flow Index (MFI) is another commonly used indicator by traders to analyze transaction price and trade volume to determine overbought and oversold levels (excess purchases and selling). A value of 80 or more generally indicates overbought prices. An oversold condition is indicated by a value of 20 or less.
Money flow indicators are used in conjunction with other technical indicators to minimize false trading signals.
Global Money Flow
The global money flow is used to understand the risks and rewards of global equity investing. It is because risks and rewards are elements of supply and demand. Stock markets were not exciting in the European stock market during the mid-1980s. Instead, they were significantly going up because pension funds from the U.S. and U.K. were pouring money into them.
At such time, pensions funds diversified their portfolio by going into overseas markets. Traders can, therefore, trade money and other assets among markets across the globe relative to risk. The risk here means the likelihood of not realizing the valuation price of an investment in the future. The idea is not to purchase a security at a low price but also to have its price appreciate.
Understanding the risks and returns of global investments requires the knowledge of cash flows, a measure of market attractiveness, and liquidity.
Drivers of Money Flow
Several factors can explain why money flows the way it does. The factors are as follows:
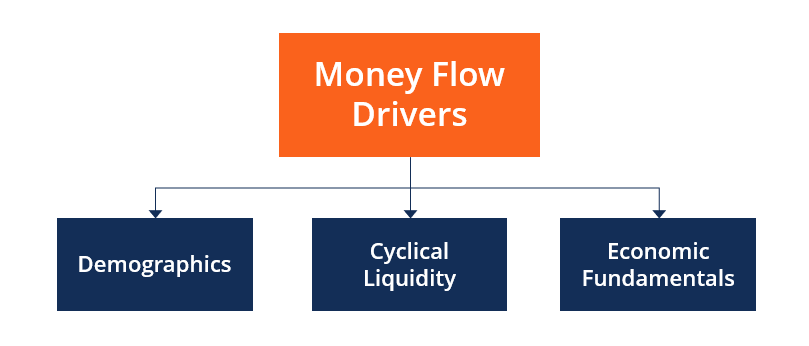
1. Demographics
The age distribution of a country’s population influences the amount and pattern of investment in a country. Aging individuals tend to invest in building up pensions, unlike youngsters who are spenders. If the aging population invests in equity-type schemes in a faster-growing economy, pensions will grow more quickly.
In the U.S. today, population aging affects money flows. More people are becoming savers due to significant population aging. The baby boomers no longer spend; rather, they strive to save more.
2. Cyclical Liquidity
Cyclical liquidity is the key to understanding the activities of central banks. Liquidity measures the operations of central banks and can be measured at a national or international level. Investors analyze the central banks’ behavior to determine the performance of various asset classes at different stages of the liquidity cycle.
3. Economic Fundamentals
Under economic fundamentals, the fundamental balance is used to monitor when an economy is heading in the wrong direction. A fundamental balance provides a clear picture of a competitive environment that can be compared with others to determine the competitiveness of an economy. Investors will look at what is happening in an economy, particularly the flow of foreign direct investmentForeign Direct Investment (FDI)Foreign direct investment (FDI) is an investment from a party in one country into a business or corporation in another country with the intention of establishing a lasting interest. Lasting interest differentiates FDI from foreign portfolio investments, where investors passively hold securities from a foreign country..
Additional Resources
CFI is the official provider of the Commercial Banking & Credit Analyst (CBCA)™Program Page - CBCAGet CFI's CBCA™ certification and become a Commercial Banking & Credit Analyst. Enroll and advance your career with our certification programs and courses. certification program, designed to transform anyone into a world-class financial analyst.
To keep learning and developing your knowledge of financial analysis, we highly recommend the additional resources below:
- Advanced Technical AnalysisAdvanced Technical AnalysisAdvanced technical analysis usually involves using either multiple technical indicators or a rather sophisticated (i.e., complex) indicator. "Sophisticated"
- Economic IndicatorsEconomic IndicatorsAn economic indicator is a metric used to assess, measure, and evaluate the overall state of health of the macroeconomy. Economic indicators
- LiquidityLiquidityIn financial markets, liquidity refers to how quickly an investment can be sold without negatively impacting its price. The more liquid an investment is, the more quickly it can be sold (and vice versa), and the easier it is to sell it for fair value. All else being equal, more liquid assets trade at a premium and illiquid assets trade at a discount.
- Rate of ReturnRate of ReturnThe Rate of Return (ROR) is the gain or loss of an investment over a period of time copmared to the initial cost of the investment expressed as a percentage. This guide teaches the most common formulas
-

Understanding Cash Flow Statements: A Comprehensive Guide
Cash flow is the amount of money coming in and going out of a company or organization during a specific accounting period.As a tool, cash flow is used to determine the solvency of a company such as h
-

Securities Explained: A Beginner's Guide to Stocks, Bonds & More
Many people wondering what securities are may not realize that they're likely already familiar with this investment category. The most common examples include stocks and bonds.Along with commodit
invest
- Venmo: A Comprehensive Guide to Peer-to-Peer Payments
- Understanding Cash Flow: A Comprehensive Guide
- Electronic Money Explained: Types, Benefits & How It Works
- Understanding Money: Definition, History & Value
- Understanding Money Laundering: Definition & How It Works
- Chaikin Money Flow (CMF): Understanding Stock Accumulation & Distribution
- Understanding Hot Money Investments: Strategies & Capital Gains Yield
- Money Flow Index (MFI): A Comprehensive Guide for Traders
- Understanding Smart Money: Definition & Strategies
-
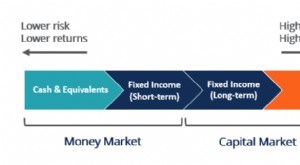
 Understanding the Money Market: Short-Term Debt & Lending
The money market is an organized exchange market where participants can lend and borrow short-term, high-quality debt securities with average maturities of one year or less. It enables governments, ba...
-
 Understanding Money Market Yields: A Comprehensive Guide
The money market yield is the yield earned from investing in liquid, short-term debt securities with less than one year maturity. Money market instruments include Treasury bills (T-bills)Treasury Bill...