Understanding Necklines in Technical Analysis: A Guide for Investors
Neckline refers to a trendline drawn below a head and shoulders pattern that is used in technical analysis that signals buying opportunities to investorsInvestorAn investor is an individual that puts money into an entity such as a business for a financial return. The main goal of any investor is to minimize risk and. It is drawn along the support and resistance points of various consolidation and reversal patterns. It connects the low points of the head and shoulders pattern, following the first two peaks.

The neckline is used by traders to determine the strategic areas to place orders. The price of the stock falling below the neckline may indicate a reversal in trends of the stock price.
Summary
- Neckline is a great tool for technical analysts, traders, and other investors to determine possible uptrend and downtrend in stock prices.
- Neckline helps establish an area of support (head and shoulders pattern) or resistanceResistance LineA Resistance Line, sometimes also known as a Speed Line, helps identify stock trends and levels of support and resistance. Resistance lines are technical indication tools used by equity analysts and investors to determine the price trend of a specific stock. (inverse head and shoulders pattern).
- Neckline, coupled with the head and shoulders pattern, is used in conjunction with other technical indicators and chart patterns to get confirmation of price trends and targets.
Neckline – Importance
The neckline drawn represents a support level, and it cannot be assumed that a head and shoulders pattern has been completed until the support level has been broken. One must be careful while analyzing the breakthroughs, as a break greater than 3%-4% may be a cause of concern.
A stock may drift through the neckline due to small volume, and the price may rise. However, the rally normally does not cross the general level of neckline before an increase in selling pressure leads to a price decrease with greater volume.
Neckline – Characteristics
- The neckline may not be perfectly horizontal. It may slope upwards or downwards.
- An upward sloping neckline can be used as a decision-making tool only if the lowest point of the right shoulder is significantly lower than the peak of the left shoulder.
Neckline in a Head and Shoulders Pattern
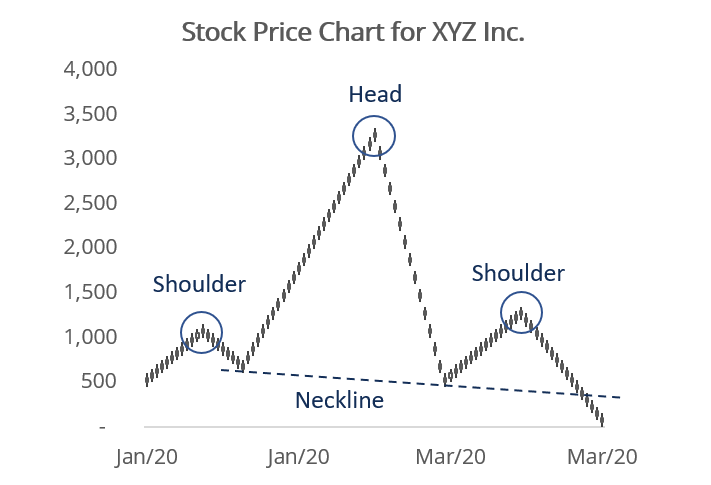
In the chart above, the stock price movement of XYZ Inc. forms a head and shoulders patternHead and Shoulders Pattern – Technical AnalysisThe head and shoulders is a pattern commonly seen in trading charts. The head and shoulders pattern is a predicting chart formation that usually indicates a reversal in trend where the market makes a shift from bullish to bearish, or vice-versa. by forming shoulders at the first and third peaks and the head at the second peak with retracements between them.
The neckline connects the two lowest points of the stock price during the trading period. A price decline below the neckline following the third peak may suggest a reversal of the uptrend and that the stock price might decline further.
The stock trading volume may also play an important role in the head and shoulders pattern. A higher volume during the advance of the left shoulder coupled with a low volume during the advance of the head and the new high of the head signal a warning sign.
The next warning sign appears when volume decreases during the decline from the peak of the head, followed by increasing volume during the decline of the right shoulder.
Price Target Using the Head and Shoulders Top Pattern
- Measure the distance from the second peak (head) to the neckline
- Locate the breakout point, i.e., where the neckline meets the outside of the right shoulder. Measure the distance found above to determine the potential downside target price level.
Neckline in an Inverse Head and Shoulders Pattern
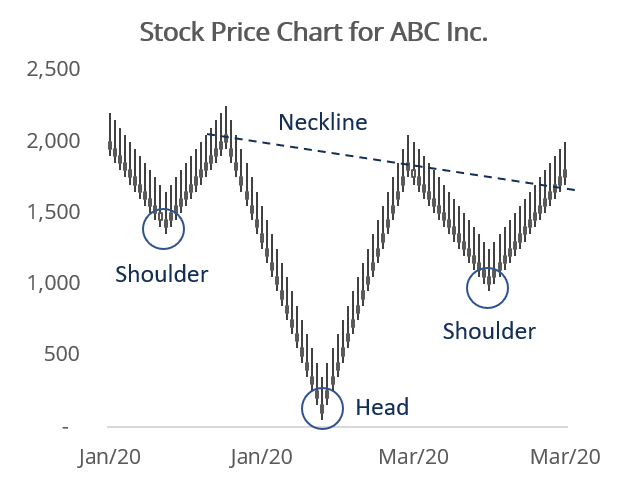
In the chart above, the stock price movement of ABC Inc. forms an inverse head and shoulders pattern by forming shoulders at the first and third troughs and the head at the second trough with retracements between them.
The neckline connects the two highest points of the stock price during the trading period. An increase in price above the neckline following the third trough may suggest a reversal of the downtrend and that the stock price might increase further.
Price Target using an Inverse Head and Shoulders Pattern
- Measure the distance from the second trough (head) to the neckline.
- Locate the breakout point, i.e., where the neckline meets the outside of the right shoulder. Measure the distance found above to determine the potential upside target price level.
Neckline in a Double Top Pattern
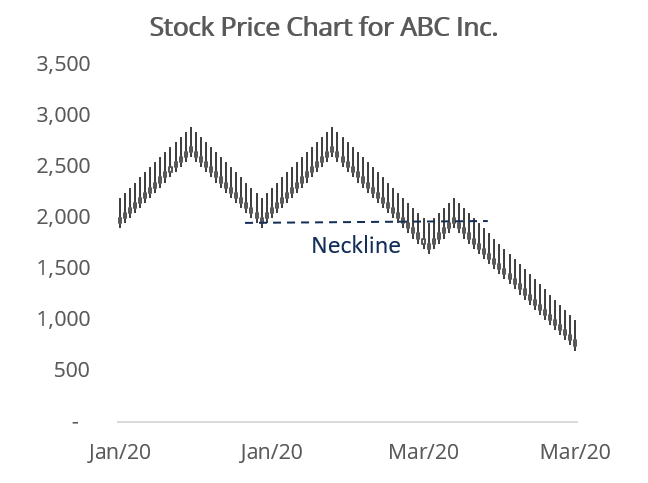
In a double top pattern, the stock price movement tests the resistance level twice but is unable to break the same, and the price declines after the third peak. In the double top pattern, the neckline is formed by connecting the first trough and the third peak.
A double bottom pattern is the inverse of the double top pattern, where the stock price movement tests the support level twice and enters a new trend and heads upwards.
Additional Resources
CFI is the official provider of the global Commercial Banking & Credit Analyst (CBCA)™Program Page - CBCAGet CFI's CBCA™ certification and become a Commercial Banking & Credit Analyst. Enroll and advance your career with our certification programs and courses. certification program, designed to help anyone become a world-class financial analyst. To keep advancing your career, the additional resources below will be useful:
- Speed Lines – Technical AnalysisSpeed Lines - Technical AnalysisSpeed lines are an analysis tool used to determine support and resistance levels. They are not intended to be used as a standalone technical indicator.
- StockStockWhat is a stock? An individual who owns stock in a company is called a shareholder and is eligible to claim part of the company’s residual assets and earnings (should the company ever be dissolved). The terms "stock", "shares", and "equity" are used interchangeably.
- Investment MethodsInvestment MethodsThis guide and overview of investment methods outlines they main ways investors try to make money and manage risk in capital markets. An investment is any asset or instrument purchased with the intention of selling it for a price higher than the purchase price at some future point in time (capital gains), or with the hope that the asset will directly bring in income (such as rental income or dividends).
- Technical Analysis Technical Analysis - A Beginner's GuideTechnical analysis is a form of investment valuation that analyses past prices to predict future price action. Technical analysts believe that the collective actions of all the participants in the market accurately reflect all relevant information, and therefore, continually assign a fair market value to securities.–Head and Shoulders Pattern – Technical AnalysisThe head and shoulders is a pattern commonly seen in trading charts. The head and shoulders pattern is a predicting chart formation that usually indicates a reversal in trend where the market makes a shift from bullish to bearish, or vice-versa. A Beginner’s GuideTechnical Analysis - A Beginner's GuideTechnical analysis is a form of investment valuation that analyses past prices to predict future price action. Technical analysts believe that the collective actions of all the participants in the market accurately reflect all relevant information, and therefore, continually assign a fair market value to securities.
-

Understanding Average Return: A Simple Guide
Average return is the mathematical average of a sequence of returns that have accrued over time. In its simplest terms, average return is the total return over a time period divided by the number of p
-

Backtesting: A Comprehensive Guide to Strategy Validation
Backtesting involves applying a strategy or predictive model to historical data to determine its accuracy. It can be used to test and compare the viability of trading strategies so tradersSix Essentia
invest
- PC Banking: A Comprehensive Guide to Online Banking Security & Features
- IRA CDs: Secure Retirement Savings with FDIC Insurance
- Understanding the DU: Your Mortgage Approval Explained
- Decentralized Finance (DeFi): A Comprehensive Overview
- Understanding Head of Household Filing Status: Definition & Requirements
- Jumbo CDs: Higher Rates & Deposits Explained
- Head Trader: Definition, Role & Responsibilities
- Understanding Cryptocurrency: A Beginner's Guide to Digital Currency
- DB(k) Plans: A Hybrid Retirement Solution for Employers & Employees
-
 Understanding Auction Markets: How Prices Are Determined
An auction market is a market where the price is determined by the highest price the buyer is willing to pay (bids), and the lowest price the seller is willing to take (offers). Bids and offers are ma...
-
 Understanding Loan Lifespan: What is Average Life?
Average life is the length of time that each unit of unpaid principal is expected to remain outstanding. The average life of mortgagesMortgageA mortgage is a loan – provided by a mortgage lender...