Understanding Tracking Error: A Guide for Investors
Tracking error is a measure of financial performance that determines the difference between the return fluctuations of an investment portfolio and the return fluctuations of a chosen benchmark. The return fluctuations are primarily measured by standard deviationsStandard DeviationFrom a statistics standpoint, the standard deviation of a data set is a measure of the magnitude of deviations between values of the observations contained.
Generally, a benchmark is a diversified market index that represents part of the total market. The most common benchmarks for equity portfolios are the S&P 500 and the Dow Jones Industrial Average (DJIA)Dow Jones Industrial Average (DJIA)The Dow Jones Industrial Average (DJIA), also referred to as "Dow Jones” or "the Dow", is one of the most widely-recognized stock market indices. for portfolios with large-cap stocks, and the Russell 2000Russell 2000The Russell 2000 is a stock market index that tracks the performance of 2,000 US small-cap stocks from the Russell 3000 index. for small-cap portfolios.
Importance of Tracking Error
Tracking error is one of the most important measures used to assess the performance of a portfolio, as well as the ability of a portfolio manager to generate excessive returns and beat the market or the benchmark. Due to the abovementioned reasons, it is used as an input to calculate the information ratioInformation RatioThe information ratio measures the risk-adjusted returns of a financial asset or portfolio relative to a certain benchmark. This ratio aims to show excess returns relative to the benchmark, as well as the consistency in generating the excess returns..
Tracking error is frequently categorized by the way it is calculated. A realized (also known as “ex post”) tracking error is calculated using historical returns. A tracking error whose calculations are based on some forecasting model is called an “ex ante” tracking error.
Low errors indicate that the performance of the portfolio is close to the performance of the benchmark. Low errors are common with index funds and ETFs that replicate the composition of major stock market indices.
High errors reveal that the portfolio’s performance is significantly different from the performance of the benchmark. The high errors can indicate that the portfolio substantially beat the benchmark, or signal that the portfolio significantly underperforms the benchmark.
Formula for Tracking
Tracking efficiency is calculated using the following formula:
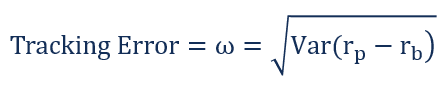
Where:
- Var – the variance
- rp – the return of a portfolio
- rb – the return of a benchmark
Example of Tracking Error
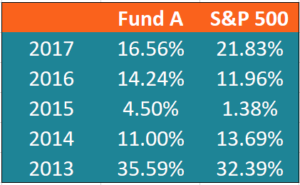
Five years ago, Sam invested $100,000 in Fund A. The fund primarily invests in large-cap US equities. During the five-year period, the fund showed positive returns. Also, the economy also grew during the period and equity markets rose.
In order to assess how successful his investment was, Sam decides to compare the returns of Fund A against the returns of a benchmark. In such a case, the most appropriate benchmark is the S&P 500 because it tracks the performance of the biggest large-cap companies.
The comparison of the fund against the benchmark can be measured using the tracking error.
The following data is available for the yearly returns for both Fund A and the S&P 500:
We can plug this data into the formula to calculate the tracking error:
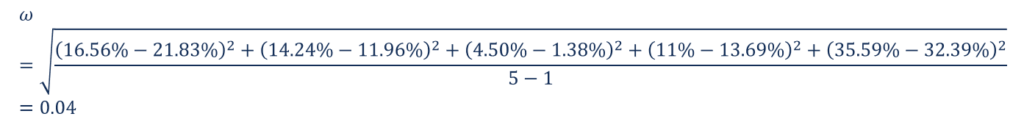
In the scenario above, the small tracking error indicates that Fund A does not significantly outperform the benchmark. Therefore, Sam may consider withdrawing his money from the fund and putting it into other, more promising investment opportunities. Alternatively, he may be satisfied with the fact that his portfolio is keeping pace with the gains of the overall market.
Related Readings
CFI is the official provider of the Financial Modeling and Valuation Analyst (FMVA)™Become a Certified Financial Modeling & Valuation Analyst (FMVA)®CFI's Financial Modeling and Valuation Analyst (FMVA)® certification will help you gain the confidence you need in your finance career. Enroll today! certification program, designed to transform anyone into a world-class financial analyst.
To keep learning and developing your knowledge of financial analysis, we highly recommend the additional resources below:
- Exchange Traded Funds (ETFs)Exchange Traded Fund (ETF)An Exchange Traded Fund (ETF) is a popular investment vehicle where portfolios can be more flexible and diversified across a broad range of all the available asset classes. Learn about various types of ETFs by reading this guide.
- Index FundsIndex FundsIndex funds are mutual funds or exchange-traded funds (ETFs) that are designed to track the performance of a market index. Currently available index funds track different market indices, including the S&P 500, Russell 2000, and FTSE 100.
- Nasdaq CompositeNASDAQ CompositeThe NASDAQ Composite is an index of more than 3,000 common equities listed on the NASDAQ stock market. The index is one of the most followed indices in the
- Small Cap StockSmall Cap StockA small cap stock is a stock of a publicly traded company whose market capitalization ranges from $300 million to approximately $2 billion.
-

Chandelier Exit Strategy: A Comprehensive Guide for Traders
Chandelier Exit (CE) is a volatility-based indicator that identifies stop loss exit points for long and short trading positionsLong and Short PositionsIn investing, long and short positions represent
-

Understanding Brokerage Churn: Risks and How to Avoid It
Churning can be defined as the practice of executing trades for a customer’s investment account by a broker or brokerage firm for the sole purpose of generating commissionCommissionCommission re
invest
- Lost Letter? How to Track and Recover Your Mail
- Anchoring Bias: Understanding How First Impressions Influence Decisions
- Arbitrage Explained: Understanding and Capitalizing on Price Differences
- Understanding Auction Markets: How Prices Are Determined
- Understanding Loan Lifespan: What is Average Life?
- Understanding Financial Benchmarks: A Comprehensive Guide
- Understanding Cryptocurrency: A Beginner's Guide to Digital Currency
- Understanding Mutual Fund Benchmarks: A Guide for Investors
- Understanding Index Fund Tracking Error: Causes & Implications
-
 Understanding Capital Losses: Definition, Calculation & Examples
Capital loss is the reduction in the value of a company’s capital, i.e., investments, capital assets, etc. The loss is realized when capital assets are sold for a price lower than the original p...
-
 CFD Trading Explained: A Comprehensive Guide for Investors
CFD (Contracts for Difference) trading is increasingly popular with experienced investors, but anyone can try it. Most online trading platformsTrading MechanismsTrading mechanisms refer to the differe...