Understanding Financial Benchmarks: A Comprehensive Guide
A benchmark is a measure used by individual and institutional investors to analyze the risk and return of a portfolio to understand how it is performing vis-à-vis other market segments. Some of the established benchmarks for standard analysis include the S&P 500, Barclays US Aggregate Bond Index, Russell 2000Russell 2000The Russell 2000 is a stock market index that tracks the performance of 2,000 US small-cap stocks from the Russell 3000 index., and the S&P United States REIT for real estate. Investors assign the benchmarks to the portfolio manager, who uses them to compare the performance of the portfolio and make investment decisions with the expected performance in mind.
Summary
- A benchmark is a measure used to analyze the performance of a portfolio compared to the performance of other market segments.
- Some of the established benchmarks include the Dow Jones Industrial Average, Russell 2000, and the S&P 500.
- The selected benchmark should correspond to the investment style of an investor and the expected return of a benchmark.
Benchmark of a Portfolio
A good benchmark should correspond to the investment style of an investor and the expected returns from the portfolio. It means that certain benchmarks will be appropriate for certain portfolios, while, at the same time, being inappropriate for other portfolios. For example, the S&P 500 can be used as a benchmark for a portfolio comprising large-cap US stocks.
However, the S&P 500 will not be an appropriate benchmark for measuring a portfolio investing in international stocks in emerging markets. It is because the benchmark may produce information that is misleading to the investor and the portfolio manager.
The most popular benchmarks for measuring the risk and return of a portfolio are market indexes such as the Russell 1000, Russell 2000, the Dow Jones Industrial AverageDow Jones Industrial Average (DJIA)The Dow Jones Industrial Average (DJIA), also referred to as "Dow Jones” or "the Dow", is one of the most widely-recognized stock market indices., and the S&P 500. There are other indexes that are specific to the industry, security classes (such as small-cap growth stocks), and other market segments. An alternative is to use other portfolios to establish benchmarks that will be used to measure the performance of the portfolio.
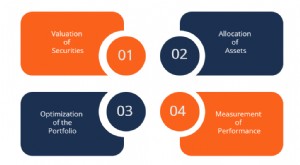
How to Use a Benchmark to Measure the Performance of Portfolio
The following are the steps involved when evaluating the performance of a portfolio against a benchmark:
1. Choose portfolio to be measured
The first step is to choose the portfolio or account whose performance is going to be measured. It can be a single investment account, an entire investment portfolio, or a collection of accounts. For example, an entire investment portfolio may include investment accounts, retirement accounts, and college savings accounts.
2. Consider the asset allocation
The next step is to consider the asset allocation in the portfolio or account. The investments may be categorized into large-cap and small-cap US stocks, international stocks (developed and emerging countries), US bonds10-Year US Treasury NoteThe 10-year US Treasury Note is a debt obligation that is issued by the US Treasury Department and comes with a maturity of 10 years., real estate, and cash. For example, the asset allocation of a college-savings account may include 60% large-cap US stocks, 20% international stocks (developed countries), 10% real estate, and 10% US bonds.
3. Identify appropriate benchmarks
The third step involves choosing an appropriate benchmark that will be used to compare the performance of a portfolio. When choosing a benchmark, you should match the asset classes in the portfolio to an appropriate benchmark. For example, you can use S&P 500 as a benchmark in a portfolio with a majority of large-cap US stocks.
However, the S&P 500 may not be ideal for measuring the performance of bonds and real estate that are added in the portfolio as a layer of safety. Bonds can use the Bloomberg Barclays Aggregate index as a benchmark, while real estate can be measured against the S&P US REIT or the S&P Global REIT.
4. Calculate actual performance vs. benchmark portfolio performance
The last step is to calculate the performance of the portfolio and compare it to the performance of the benchmark. The expectation of the investor is that the portfolio will perform in a way that it meets their expected returns, as well as the risk tolerance. When comparing the actual performance versus the benchmark performance, the investor wants to determine if the portfolio earned the expected returns as agreed with the portfolio manager.
Managing Risk in a Portfolio Investment
One of the ways that investors use to manage risk is to diversify their portfolio. They do the diversification by including different types of asset classes such as equities, stocks, and bond. Also, most investors who are looking to get returns in the long term are willing to invest more heavily in higher-risk investments. Investors can use various risk metrics to determine the riskiness of the investments. The main risk metrics used by investors include standard deviation, beta, and Sharpe Ratio.
1. Standard Deviation
Standard deviation measures the volatility of a portfolio during a given period of time. An investment with a higher standard deviation has higher volatility and therefore, greater risk of loss.
2. Beta
Beta measures the systematic riskSystematic RiskSystematic risk is that part of the total risk that is caused by factors beyond the control of a specific company or individual. Systematic risk is caused by factors that are external to the organization. All investments or securities are subject to systematic risk and therefore, it is a non-diversifiable risk. of a portfolio by determining the volatility of the portfolio in relation to a particular benchmark. If an investment has a beta of less than one, it is considered to be less volatile than one. If the investment has a beta of one, it means that there is a direct correlation between the risk and the reward of the investment, i.e., the higher the risk, the higher the reward. If the beta is greater than one, it is considered to be aggressive, and therefore more volatile than the benchmark. When using beta as a measure of risk, we use the S&P 500 as the benchmark.
3. Sharpe Ratio
The Sharpe ratio is commonly used as a measure of risk-adjusted return. It shows the amount of excess return that an investor will receive for the extra volatility of a riskier asset. When calculating the Sharpe ratio, an investor can use the projected performance of the portfolio and the risk-free rate. The ratio can help an investor determine the highest return than an investment will earn while considering the risk involved.
More Resources
CFI offers the Financial Modeling & Valuation Analyst (FMVA)™Become a Certified Financial Modeling & Valuation Analyst (FMVA)®CFI's Financial Modeling and Valuation Analyst (FMVA)® certification will help you gain the confidence you need in your finance career. Enroll today! certification program for those looking to take their careers to the next level. To keep learning and advancing your career, the following resources will be helpful:
- Index FundsIndex FundsIndex funds are mutual funds or exchange-traded funds (ETFs) that are designed to track the performance of a market index. Currently available index funds track different market indices, including the S&P 500, Russell 2000, and FTSE 100.
- Market CapitalizationMarket CapitalizationMarket Capitalization (Market Cap) is the most recent market value of a company’s outstanding shares. Market Cap is equal to the current share price multiplied by the number of shares outstanding. The investing community often uses the market capitalization value to rank companies
- Sharpe RatioSharpe RatioThe Sharpe Ratio is a measure of risk-adjusted return, which compares an investment's excess return to its standard deviation of returns. The Sharpe Ratio is commonly used to gauge the performance of an investment by adjusting for its risk.
- Stock Performance BenchmarkingStock Performance BenchmarkingStock performance benchmarking is a strategy employed by investors to help determine the different performance aspects of an investment portfolio. Investors
-

Active Bond Portfolio Management: Strategies & Benefits
A bond portfolio can be managed in several ways; however, the primary methods are active, passive, or a hybrid of the two. Active bond portfolio management, as the name suggests, means the portfolio m
-

Investment Diversification: A Comprehensive Guide
Imagine you’re walking down the street, minding your own business, when all of a sudden you walk past a candy shop, the kind where you can scoop the candy out of bins and fill up a plastic bag full of
invest
- Portfolio Variance: Understanding Risk and Diversification
- Active Management: Strategies & How It Works | [Your Company Name]
- Bullet Bond Portfolios: A Comprehensive Guide
- What is an Efficient Frontier?
- Fixed Income Portfolio: Definition, Types & Benefits
- Investment Portfolio: Definition, Types & Building a Strong One
- Laddered Bond Portfolio: A Risk-Mitigating Investment Strategy
- Portfolio Planning: A Comprehensive Guide to Investment Strategies
- Portfolio Rebalancing: A Comprehensive Guide for Investors
-
 Understanding Homogeneous Expectations in Portfolio Theory
Homogeneous expectations is a subjective belief, entrenched in the Modern Portfolio Theory (MPT) proposed by American economist Harry Markowitz, and postulates that all investors have the same expecta...
-
 Portfolio Turnover Ratio: Definition, Calculation & Significance
The portfolio turnover ratio is the rate of which assets in a fund are bought and sold by the portfolio managers. In other words, the portfolio turnover ratio refers to the percentage change of the as...