Understanding Value-Added Monthly Indices (VAMI): A Comprehensive Guide
A value-added monthly index (VAMI) is a type of index used by investors to measure the performance of an investment based on a hypothetical $1,000 investment over a period of time. Also, the VAMI is used to compare various funds, set goals, budget for capital expendituresCapital ExpendituresCapital expenditures refer to funds that are used by a company for the purchase, improvement, or maintenance of long-term assets to improve, evaluate the performance of fund managers, and provide index benchmarks over a specified time.
The value-added monthly index is a commonly used indicator for tracking investment accounts where withdrawals and cash deposits do not affect the trading performance.
Summary
- A value-added monthly index (VAMI) is an approach used to track the performance of an assumed hypothetical investment of $1,000 over a period of time.
- The main characteristic of a value-added monthly index is that it calculates the remaining profit after deducting incentives and management fees from the operating income.
- VAMI tools can use varying amounts of starting capital and different time ranges when estimating the performance of fund managers.
Understanding the Value-Added Monthly Index
A value-added monthly index provides an estimate of an investor’s total profits, less the cost of financing the company’s capital. It is calculated by assuming capital gains, as well as reinvestment of all interest and profit incomes.
The distinguishing factor between VAMI and other performance-measurement metrics, such as earnings per share (EPS)Earnings Per Share (EPS)Earnings per share (EPS) is a key metric used to determine the common shareholder's portion of the company’s profit. EPS measures each common share's profit and value-at-risk (VaR)Value at Risk (VaR)Value at Risk (VaR) estimates the risk of an investment. VaR measures the potential loss that could happen in an investment portfolio over a period of time., is that it determines the profit remaining after deducting incentives and management fees from the operating profit. It implies that when calculating the shareholder value, profit should account for the capital costs.
Another important aspect of VAMI is that it reflects monthly economic gain or the amount by which earning growth falls short of or exceeds the required threshold of a return on investment that investors can get by investing in other securities of comparable risks.
VAMI is commonly used as a performance indicator to communicate a fund’s overall performance to investors. The index is preferred as a performance indicator since it is fair, descriptive, and easy to understand, and can, therefore, give an overview of how a $1,000 investment performed over a specified period.
How to Calculate the Value-Added Monthly Index
Consider a hypothetical investment capital of $1,000 at inception. At the beginning, time (t) = 0, VAMI = $1,000. The monthly rate of return (ROR) of the underlying investment is given by:
1 + Current Rate of Return = Current Month VAMI / Previous Month VAMI
1 + RORt = Vt / Vt – 1
However, VAMI0 = $1,000
Hence:
Previous VAMI= 1,000 * (1 + Current Month’s Net Return)
Current VAMI = Previous VAMI * (1 + Current Month’s Net Return), denoted as
VAMIt = VAMIt-1 [Vt / (Vt – 1)], where RORt represents the net of all fees
Interests and dividends are reinvested through compounding into the VAMI. It means that besides quantifying the potential financial risks of $1,000, the index can easily compare different assets with different starting dates.
From the model, the value-added monthly index serves as a simple form of back-testing the risk-return features of an investment. VAMI represents the hypothetical investment value of $1,000 before tax, on the condition that the RORt is net of all fees. The foreign exchange rateForeign ExchangeForeign exchange (Forex or FX) is the conversion of one currency into another at a specific rate known as the foreign exchange rate. The conversion rates for almost all currencies are constantly floating as they are driven by the market forces of supply and demand. must be considered for underlying assets whose denomination is not in US dollars.
Application of VAMI for Comparisons
Analysts use graphed VAMI as a reliable instrument to analyze the performance of various funds across the markets. The charts of VAMI can be customized to fit well into a company’s family of funds and provide options from which investors can choose from. Graphed VAMI also provides an overview of an investment’s performance over time.
In addition, the charts may provide perspectives on what to anticipate with future market predictions. Visual representations of the VAMI line chart can also be used to show the overtime performance of funds from various categories of assets. For an in-depth analysis, benchmark returns are included in the VAMI charts.
However, VAMI is biased when used to compare the performance of different funds from similar asset categories. It only estimates factors in capital appreciation and not dividends paid by different funds. Thus, the measures of VAMI make stocks that pay dividends seem inferior compared to asset categories that do not pay dividends.
Constructing VAMI Instruments
Investors use VAMI tools from various market platforms to measure the performance of investments. Apart from the ability to show the extent to which an investment grows over a specified period, VAMI instruments also incorporate varying inputs, such as different time range and starting capital, when determining market performance.
A software application is the standard modeling technique that is used to construct a value-added monthly index. The process begins with a hypothetical investment value of $1,000. The data for each month is required to plot a relevant graph. The factors can affect the measure of symmetry for the estimated values.
Graphing of VAMI charts can be performed using Microsoft Excel or any befitting technical software program. Most financial services firms provide online versions, such as CTA databases or tear sheetsTear SheetIn the world of finance, a tear sheet provides a one-page summary of the company with information such as Market Price, 52-week High and Low, Market, to help in analyzing returns on performance. For example, aiSource offers VAMI tools to its clients, which is part of its futures investment advice and call to action research (CTA).
More Resources
CFI is the official provider of the global Commercial Banking & Credit Analyst (CBCA)™Program Page - CBCAGet CFI's CBCA™ certification and become a Commercial Banking & Credit Analyst. Enroll and advance your career with our certification programs and courses. certification program, designed to help anyone become a world-class financial analyst. To keep advancing your career, the additional resources below will be useful:
- Advanced Technical AnalysisAdvanced Technical AnalysisAdvanced technical analysis usually involves using either multiple technical indicators or a rather sophisticated (i.e., complex) indicator. "Sophisticated"
- Financial Analyst Performance GoalsFinancial Analyst Performance GoalsFinancial analyst performance goals are the tasks a financial analyst aims to accomplish within a given time frame. Setting goals makes performance reviews easier.
- Rate of ReturnRate of ReturnThe Rate of Return (ROR) is the gain or loss of an investment over a period of time copmared to the initial cost of the investment expressed as a percentage. This guide teaches the most common formulas
- Investing: A Beginner’s GuideInvesting: A Beginner's GuideCFI's Investing for Beginners guide will teach you the basics of investing and how to get started. Learn about different strategies and techniques for trading
-
DAX Index: Your Guide to Germany's Top 30 Companies
The DAX (Deutscher Aktien Index) is a stock index based out of Germany that represents the 30 biggest German companies that trade on the Frankfurt Exchange. The index value is calculated every second
-
Exchange-Traded Products (ETPs): A Comprehensive Guide
An exchange-traded product (ETP) refers to a financial product that is publicly traded like a bond in the stock market. ETPs offer a cost-effective and safe way to diversify an investment portfolio by
invest
- Understanding Value Added Monthly Index (VAMI) - Investment Performance
- EAFE Index: Understanding Developed Market Performance
- Equal-Weighted Index Explained: Benefits & How It Works
- High-Low Index: Understanding 52-Week Highs & Lows | [Your Brand]
- Index Investing: A Beginner's Guide to Passive Investing
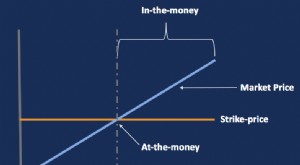
- Understanding Index Options: A Comprehensive Guide
- Understanding Market Indexes: A Comprehensive Guide
- Stock Indexes Explained: A Beginner's Guide to Market Benchmarks
- Composite Indexes: Understanding Financial Benchmarks & Their Use
-
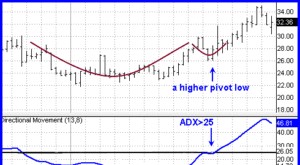 ADX Indicator: Understanding Trend Strength for Trading
The Average Directional Movement Index (ADX) was developed by famed technical analyst Welles Wilder as an indicator of trend strength. As a commodity traderKnowledgeCFI self-study guides are a great w...
-
 Arms Index (TRIN): Understanding Short-Term Market Sentiment
The Arms Index, also known as the Short-Term Trading Index (TRIN), refers to a short-term technical analysis trading indicator that compares the number of advancing and declining stocks issues with th...