Arms Index (TRIN): Understanding Short-Term Market Sentiment
The Arms Index, also known as the Short-Term Trading Index (TRIN), refers to a short-term technical analysis trading indicator that compares the number of advancing and declining stocks issues with the advancing and declining volume.
Summary
- The Arms Index, also known as the Short-Term Trading Index (TRIN), refers to a short-term technical analysis trading indicator that compares the number of advancing and declining stocks issues with the advancing and declining volume.
- There are three readings in the TRIN – at, below, or above 1.0.
- The Arms Index is an important indicator that is used in finance, but at the same time, it is often used in conjunction with other indices.
Arms Index Formula
Developed by Richard W. Arms Jr. in 1967, the Arms Index is calculated by dividing the advancing/declining ratio (AD ratio) by the advancing/declining volume (AD volume). The value 1 is especially important here, as crossing it indicates whether the market is strong or weakBullish and BearishProfessionals in corporate finance regularly refer to markets as being bullish and bearish based on positive or negative price movements. A bear market is typically considered to exist when there has been a price decline of 20% or more from the peak, and a bull market is considered to be a 20% recovery from a market bottom..
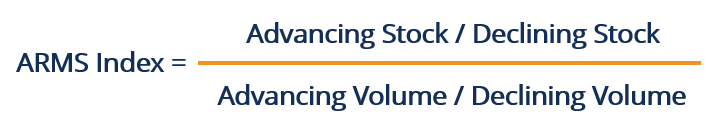
The formula to calculate the TRIN Index is comprised of the following items:
- Advancing Stock: They are stock issues that have increased compared to previous readings.
- Declining Stock: They are stock issues that have decreased compared to previous readings.
- Advancing Volume: It is the number of stocks that have advanced.
- Declining Volume: It is the number of stocks that have declined.
A key component of the Arms Index is the Advance-Decline (AD) RatioAdvance Decline RatioThe advance decline ratio (ADR) is a technical indicator used to assess stock market sentiment. The ratio compares the number of stocks that increased in, which is the number of advancing stocks divided by the number of declining stocks.
How to Calculate the Arms Index?
The Arms Index can be calculated using various charting applications and software, but it can also be calculated by hand.
1. First, calculate the AD ratio (Advancing Stock divided by Declining Stock) at set intervals.
2. Calculate the AD Volume (Advancing Volume divided by Declining Volume).
3. Divide the AD Ratio by AD Volume.
4. Then, record the results, plot on a graph, and repeat the process at the next time interval.
5. The last step is to connect multiple data points to form a graph to see the movement of the TRIN over time.
TRIN Readings
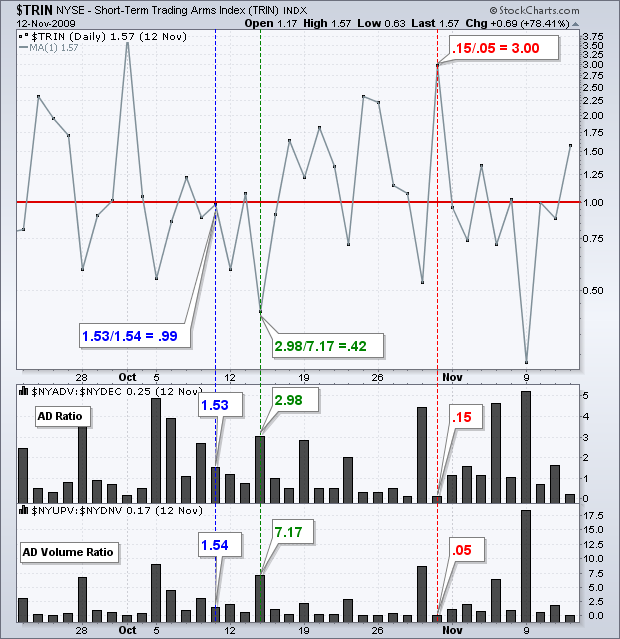
The TRIN indicates three possible results. The value 1.0 is especially important here, as crossing it indicates whether the market is strong or weak.
The first result is an index value of 1.0, which means that the AD ratio is equal to the AD volume ratio, and the market is in a neutral state. The advancing volume is distributed evenly over the advancing issues, and the declining volume is evenly distributed over the declining issues.
The second result is a result of less than 1.0. It means that the AD Volume results in a higher ratio than the AD Ratio and is a strong indicator of a bull market. A TRIN reading below 1.0 usually results in a strong price advance, which is due to the strong volume in rising stocks.
The third result is a reading above 1.0. It means that the AD Volume results in a lower ratio than the AD ratio and is a strong indicator of a bear market. A TRIN reading above 1.0 results in a strong price decline due to the strong volume of declining stocks. In other words, there is a greater volume in the average declining stock than in the average advancing stock.
Importance of the Arms Index
The Arms Index plays an important role in finance – to the extent that the TRIN is displayed on the New York Stock ExchangeNew York Stock Exchange (NYSE)The New York Stock Exchange (NYSE) is the largest securities exchange in the world, hosting 82% of the S&P 500, as well as 70 of the biggest’s central wall display continuously during trading hours. The Arms Index distinguishes itself from other indices by incorporating the volume of stocks into consideration. There are many indices available, and companies should use more than one to provide a more thorough analysis.
It is important to note that the farther away from 1 the TRIN reading is, the larger the contract between the buying and selling of stocks. Typically, a value exceeding 3 indicates an oversold market, and bearish sentiment is too dramatic. It might lead to an upward reversal in the prices in the near future. Also, a TRIN reading below 0.5 might mean that the market is overbought, and bullish sentiment is overheating.
It is important to refer to several indices instead of only one to get a better understanding of the situation. In addition, not only is the TRIN reading examined carefully, but the rate of change during the day is also looked at closely to see if the market may change directions in the future.
Arms Index Pros and Cons
As an oscillator, the Arms Index provides real-time information on the TRIN and enables the user to know when to buy or sell the stock in question. By separating the stocks into advancing and declining ones, the index is easy to read and understand. Its incorporation of stock volumeVolume of TradeVolume of trade, also known as trading volume, refers to the quantity of shares or contracts that belong to a given security traded on a daily basis is especially important to users.
However, there are also drawbacks to the Arms Index. For example, the system might include errors in the analysis and give false readings as a result. As such, the Arms Index needs to be used in conjunction with other indices to get cohesive results.
Related Readings
CFI is the official provider of the Commercial Banking & Credit Analyst (CBCA)™Program Page - CBCAGet CFI's CBCA™ certification and become a Commercial Banking & Credit Analyst. Enroll and advance your career with our certification programs and courses. certification program, designed to transform anyone into a world-class financial analyst.
In order to help you become a world-class financial analyst and advance your career to your fullest potential, these additional resources will be very helpful:
- Advanced Technical AnalysisAdvanced Technical AnalysisAdvanced technical analysis usually involves using either multiple technical indicators or a rather sophisticated (i.e., complex) indicator. "Sophisticated"
- MACD OscillatorMACD Oscillator - Technical AnalysisThe MACD Oscillator is used to examine short-term moving average convergence and divergence. The MACD Oscillator is a double-edged technical indicator in that it offers traders and analysts the ability to follow trends in the market, as well as gauge the momentum of price changes.
- Moving AverageMoving AverageA moving average is a technical indicator that market analysts and investors may use to determine the direction of a trend. It sums up the data points
- Speed LinesSpeed Lines - Technical AnalysisSpeed lines are an analysis tool used to determine support and resistance levels. They are not intended to be used as a standalone technical indicator.
-
Herrick Payoff Index: Understanding Derivative Market Trends
The Herrick Payoff Index is a forward-looking technical analysis tool used to identify trends in derivative markets. Using price, volume, and open interest, the index provides an overview of money flo
-
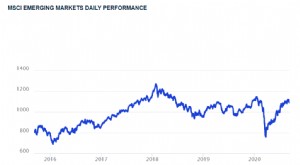
MSCI Emerging Markets Index: Definition & Key Facts
The MSCI Emerging Markets Index is used to measure the stock market performance within emerging countries. Established in the 1960s, It is one of many indexes created by Morgan Stanley Capital Interna
invest
- TRIN: Understanding the Arms Index for Market Sentiment
- Advance-Decline Line: Understanding Market Sentiment & Trends
- DAX Index: Your Guide to Germany's Top 30 Companies
- EAFE Index: Understanding Developed Market Performance
- KBW Bank Index: Tracking US Banking Sector Performance
- Negative Volume Index (NVI): A Comprehensive Guide
- Nikkei Index: Understanding Japan's Top Stock Market Indicator
- Price-Weighted Index Explained: How It Works & Examples
- Understanding the S&P 500: Top Holdings & Long-Term Performance
-
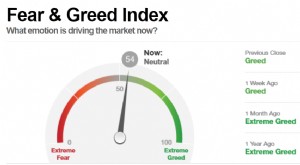 Fear & Greed Index: Understanding Investor Sentiment | CNN Business
The Fear and Greed Index, developed by CNNMoney, is used to gauge whether investors are too bullish or bearish on the stock market. The index ranges from 0 (extreme fear) to 100 (extreme greed). ...
-
 Hang Seng Index (HSI): A Comprehensive Guide to Hong Kong's Stock Market
The Hang Seng Index (HSI) is a stock market index in Hong Kong. It records and monitors the daily changes in stock prices of the 50 largest Hong Kong stock market companies. As the companies represent...