Weighted Moving Average (WMA): Definition, Calculation & Trading Strategies
The weighted moving average (WMA) is a technical indicator that traders use to generate trade direction and make a buy or sell decision. It assigns greater weighting to recent data points and less weighting on past data points. The weighted moving average is calculated by multiplying each observation in the data set by a predetermined weighting factor.
Traders use the weighted average tool to generate trade signals. For example, when the price action moves towards or above the weighted moving average, the signal can be an indication to exit a trade. However, if the price action dips near or just below the weighted moving average, it can be an indication of a favorable time to enter a trade.
Using the weighted moving average to determine trend direction is more accurate than the simple moving average, which assigns identical weights to all numbers in the data set.
Summary
- The weighted moving average (WMA) is a technical indicator that assigns a greater weighting to the most recent data points, and less weighting to data points in the distant past.
- The WMA is obtained by multiplying each number in the data set by a predetermined weight and summing up the resulting values.
- Traders use weighting moving average to generate trade signals, to indicate when to buy or sell stocks.
How to Calculate the Weighted Moving Average
When calculating the weighted moving average, the recent data points are assigned a greater weighting, whereas past data points are assigned less weighting. It is used when the figures in the data set come with different weights, relative to each other. The sum of the weight should be equal to 1 or 100%.
It is different from the simple moving average, where all numbers are assigned an equal weighting. The final weighted moving average value reflects the importance of each data point, and it is, therefore, more descriptive of the frequency of concurrency than the simple moving average.
Example 1
Follow the following steps when calculating weighted moving average:
1. Identify the numbers you want to average
The first step is to create a list of the numbers for which the user needs to find the weighted average. Here, we can use the closing prices of ABC stock for the period starting January 1 to January 5. The closing prices are $90, $88, $89, $90, and $91, with the first number being the most recent.
2. Determine the weights of each number
After identifying the numbers for which to calculate the weighted average, the next step is to determine the weight of each number to know how much each of the numbers weighs. In such a case, we give the highest weighting to the recent data point out of a random 15 points, as shown in the table below:
Date Closing PriceWeightingJanuary 1$911/15January 2$902/15January 3$893/15January 4$884/15January 5$905/15
3. Multiply each number by the weighting factor
After determining the weighting for each number, the next step is to multiply each of the numbers from January 1 to 5 by the corresponding weighting factor and then sum up the resulting values. It is shown below:
Date Closing PriceWeightingWeighted AverageJanuary 1$911/15$6.07January 2$902/15$12January 3$893/15$17.80January 4$884/15$23.47January 5$905/15$30
The formula for the weighted moving average is expressed as follows:
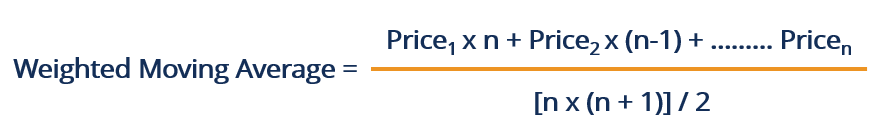
Where:
- N is the time period
4. Add up resulting values to get the weighted average
The final step is to add up the resulting values to get the weighted average for the closing prices of ABC Stock.
WMA = $30 + $23.47 + $17.80 + $12 + $6.07
WMA = $89.34
Therefore, the weighted moving average for the period from January 1 to January 5 is $89.34.
Example 2
Assume that the number of periods is 10, and we want a weighted moving average of four stock prices of $70, $66, $68, and $69, with the first price being the most recent.
Using the information given, the most recent weighting will be 4/10, the previous period before that will be 3/10, and the next period before that will be 2/10, and the initial period weighting will be 1/10.
The weighting average for the four different prices will be calculated as follows:
WMA = [70 x (4/10)] + [66 x (3/10)] + [68 x (2/10)] + [69 x (1/10)]
WMA = $28 + $19.80 + $13.60 + $6.90 = $68.30
Simple Moving Average vs. Weighted Moving Average
Simple moving average and weighted moving average are the two widely used statistics in the world, and they are used to find the average of observations in a data set.
The main difference between the two statistical measures is that simple moving average calculates the average by summing up all the observations in a data set and dividing the total by the total number of observations. In simple terms, it applies equal weighting to all the observations in the sample.
On the other hand, weighted moving average assigns a specific weight or frequency to each observation, with the most recent observation being assigned a greater weight than those in the distant past to obtain the average.
Related Readings
CFI is the official provider of the global Commercial Banking & Credit Analyst (CBCA)™Program Page - CBCAGet CFI's CBCA™ certification and become a Commercial Banking & Credit Analyst. Enroll and advance your career with our certification programs and courses. certification program, designed to help anyone become a world-class financial analyst. To keep advancing your career, the additional CFI resources below will be useful:
- How To Read Stock ChartsHow to Read Stock ChartsIf you’re going to actively trade stocks as a stock market investor, then you need to know how to read stock charts. Even traders who primarily use fundamental analysis to select stocks to invest in still often use technical analysis of stock price movement to determine specific buy and sell, stock charting
- Kaufman’s Adaptive Moving Average (KAMA)Kaufman’s Adaptive Moving Average (KAMA)Kaufman’s Adaptive Moving Average (KAMA) was developed by American quantitative financial theorist, Perry J. Kaufman, in 1998. The technique began in 1972 but Kaufman officially presented it to the public through his book, "Trading Systems and Methods." Unlike other moving averages
- Momentum InvestingMomentum InvestingMomentum investing is an investment strategy aimed at purchasing securities that have been showing an upward price trend or short-selling securities that
- Noise TraderNoise TraderA noise trader is an individual who trades based on incomplete or inaccurate data, often trading irrationally. Noise traders often make trades based on hype
-

Understanding Average Selling Price (ASP): Definition & Calculation
The average selling price (ASP) is a term that refers to the price that a good or service is sold for. As the name implies, it is an average price. If a company sells hundreds of thousands of cell pho
-
Weighted Average Shares Outstanding: Definition & Calculation
Weighted average shares outstanding refers to the number of shares of a company calculated after adjusting for changes in the share capital over a reporting period. The number of shares of a comp
invest
- Understanding Weighted Averages: Benefits & Applications
- Average True Range (ATR): Understanding Volatility & Trading
- Double Exponential Moving Average (DEMA): A Trading Guide
- Exponential Moving Average (EMA): Definition & Trading Uses
- Exponentially Weighted Moving Average (EWMA): Definition & Applications
- MACD Oscillator: Understanding & Trading Strategies
- Qstick Indicator: Definition, Calculation & Trading Strategies
- Simple Moving Average (SMA): A Comprehensive Guide for Investors
- Understanding Average Inventory: Definition & Calculation
-
 Pool Heating Costs: A Comprehensive Guide to Average Expenses & Savings
The cost of building, maintenance and supplying a swimming pool is considerable. Add to that the price to heat a pool and it becomes even more of a burden. If you are planning to build a pool, or if y...
-
Moving Average (MA): Understanding and Using a Key Technical Indicator
What Is a Moving Average (MA)? In statistics, a moving average is a calculation used to analyze data points by creating a series of averages of different subsets of the full data set. In financ...