Exponential Moving Average (EMA): Definition & Trading Uses
The Exponential Moving Average (EMA) is a technical indicator used in trading practices that shows how the price of an asset or securitySecurityA security is a financial instrument, typically any financial asset that can be traded. The nature of what can and can’t be called a security generally depends on the jurisdiction in which the assets are being traded. changes over a certain period of time. The EMA is different from a simple moving average in that it places more weight on recent data points (i.e., recent prices).
The aim of all moving averages is to establish the direction in which the price of a security is moving based on past prices. Therefore, exponential moving averages are lag indicators. They are not predictive of future prices; they simply highlight the trend that is being followed by the stock price.
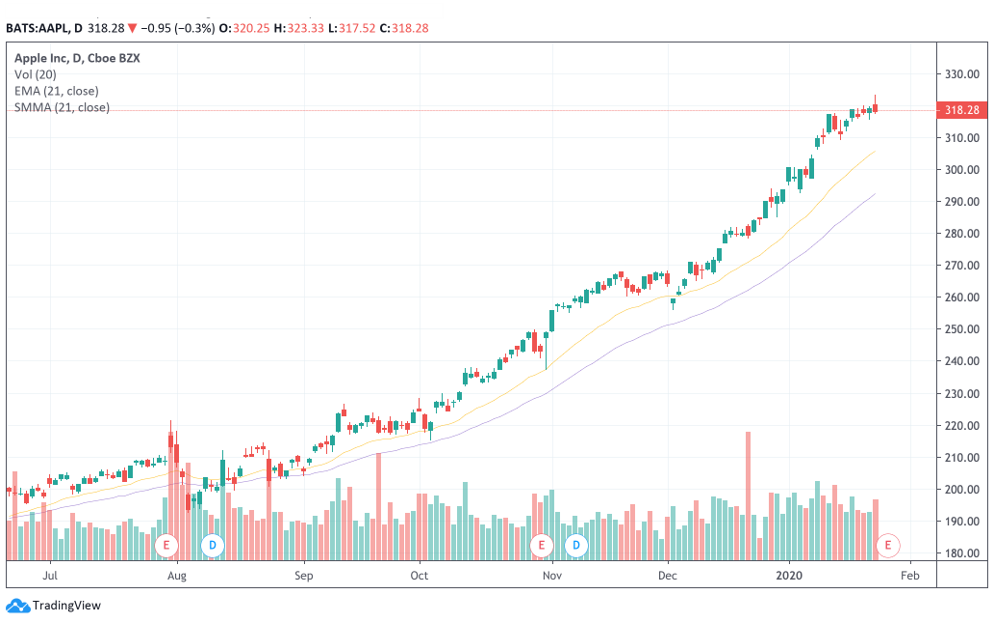
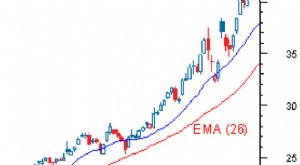
The chart below shows how the price of Apple’s stock (NASDAQ: AAPL) changed over a six-month period. Each candlestickJapanese CandlestickJapanese Candlesticks are a technical analysis tool that traders use to chart and analyze the price movement of securities. The concept of candlestick charting was developed by Munehisa Homma, a Japanese rice trader. shows how the price of the stock changed over one trading day (there are, on average, 21 trading days in a month), with green candlesticks indicating a rise in the stock price and red candlesticks representing price drops.
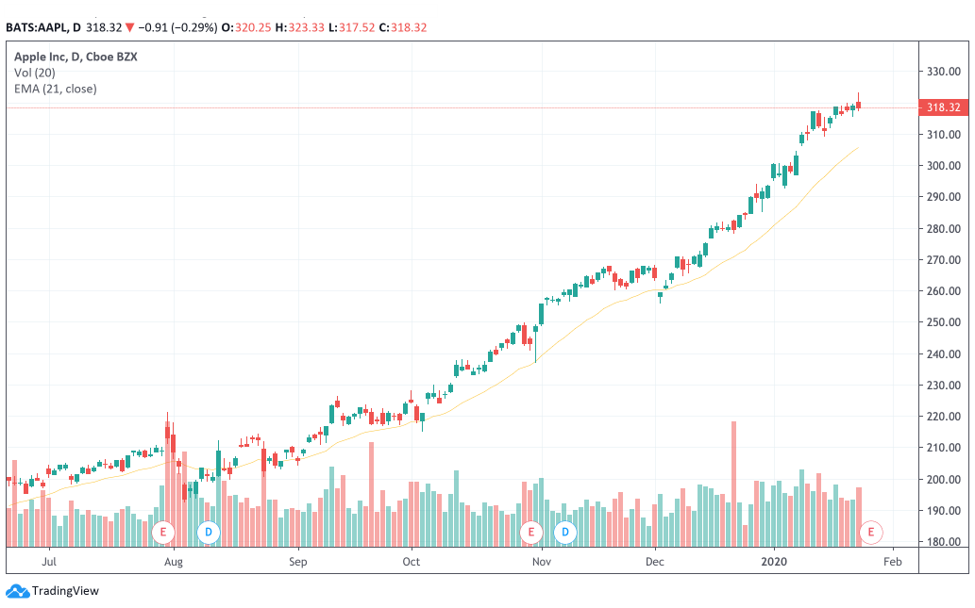
The orange line below the candlesticks is the EMA line, which indicates that the price’s been following an upward trend over the period of July 2019 – January 2020. The 21-day EMA line moves closely with Apple’s stock price and is sensitive to volatilityVolatilityVolatility is a measure of the rate of fluctuations in the price of a security over time. It indicates the level of risk associated with the price changes of a security. Investors and traders calculate the volatility of a security to assess past variations in the prices, which makes it a useful indicator for investors that are looking to enter or exit trades.
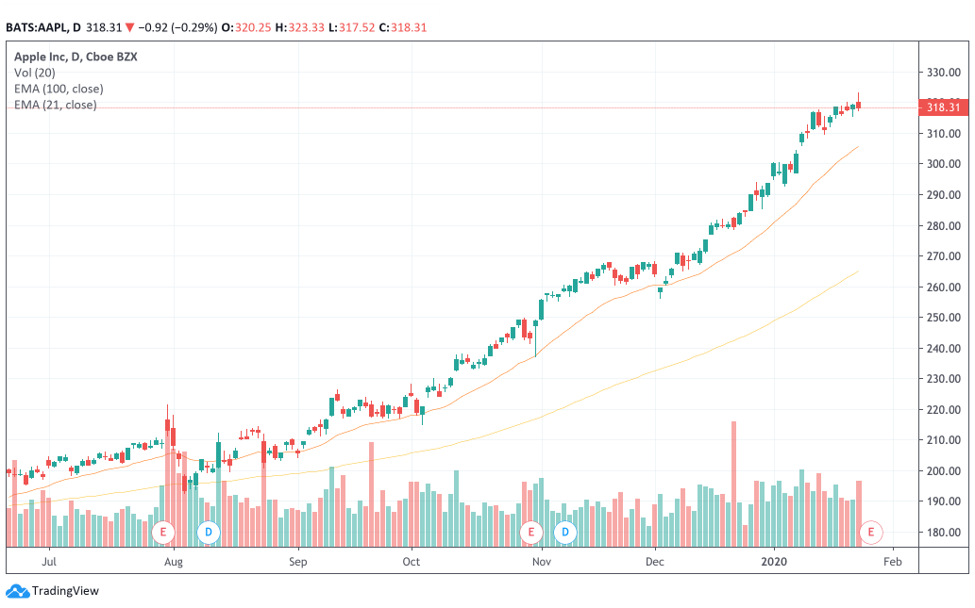
An important caveat to note is that EMAs taken over shorter periods of time are more sensitive to prices. So, a 21-day EMA line (orange) follows the prices more closely compared to a 100-day EMA line (yellow), as shown below:
Calculating the Exponential Moving Average
The formula for calculating the EMA is as follows:
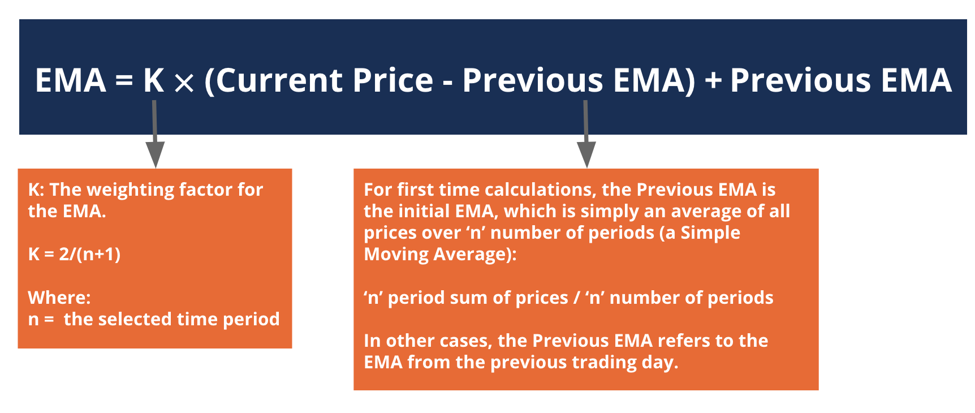
As exemplified in the chart above, EMAs calculated over a fewer number of periods (i.e., based on more recent prices) show a higher weightage than those calculated over longer periods. It can be shown by calculating the value of “K” for two different time periods:
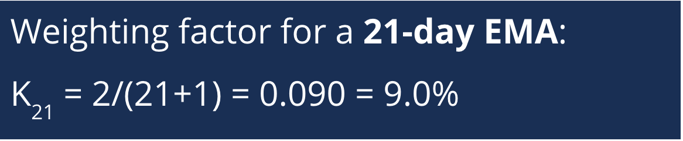
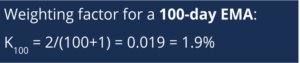
The 21-day EMA places a 9.0% weight on the most recent price, whereas the 100-day EMA only places a 1.9% weight. Therefore, EMAs calculated over shorter periods are more responsive to price changes than those calculated over longer periods.
Applications of the Exponential Moving Average
1. Highlighting trends
Highlighting and identifying price trends are one of the most important functions of an EMA. A rising EMA indicates that prices are on an upward trend and vice versa. When the price is above the EMA line, it is likely to rise, and when it is below, it’s likely to fall. By identifying price directions, the EMA allows investors and traders to spot buying and selling signals based on their trading strategyDirectional Trading StrategiesDirectional options strategies are trades that bet on the up or down movement of the market. For example, if an investor believes the market is rising,.
2. Support and Resistance bands
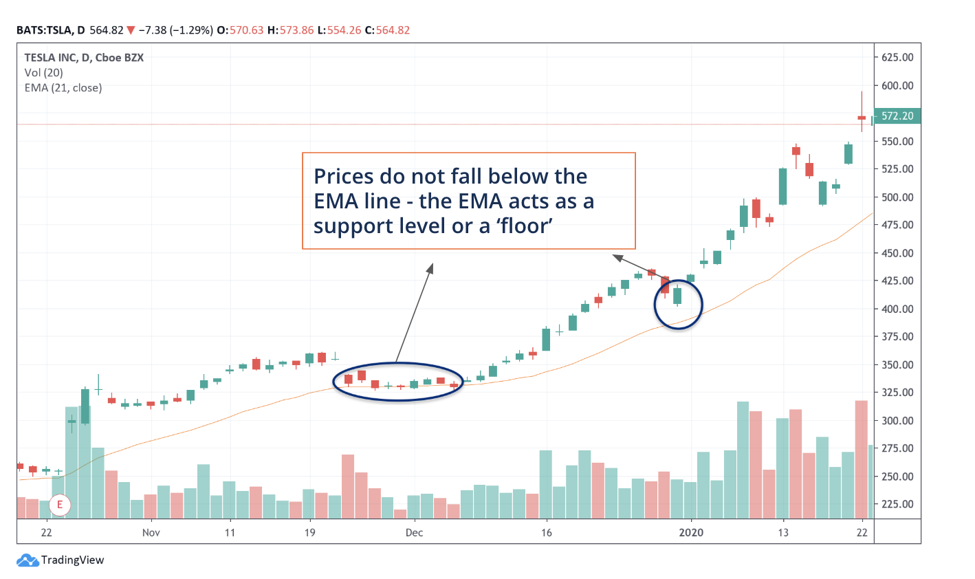
The EMA and other types of moving averages also function as support and resistance levels for prices. Support levels are also known as “floors” – they act as the limit for how far prices are expected to fall during uptrends. It is illustrated in the chart below, which shows the price action and 21-day EMA of Tesla (NASDAQ: TSLA) stock over the period of October 2019 – January 2020:
On the other hand, resistance levels are like “ceilings” – prices are not expected to exceed the levels during downtrends. It is highlighted in the chart below, which shows the price action and 21-day EMA of Snapchat (NASDAQ: SNAP INC.) stock over the period of August 2018 – January 2019:

Exponential Moving Average vs Simple Moving Average
The exponential moving average (EMA) and the simple moving average (SMA) are both technical indicators that use past data to generate a smooth trend line for the price of a security. The difference between the two moving averages is that EMA places a greater weight on recent prices, whereas SMA places equal weight on all data points, which is why the EMA line turns more quickly than the SMA line. It is illustrated in the chart below:
However, it is important to note that none of the moving averages is a better indicator than each other. For example, although an EMA is a more accurate representation of recent price movements and helps identify trends quicker, it also experiences more short-term fluctuations than an SMA. The optimal moving average to use for analysis depends on the trading strategy.
Additional Resources
CFI offers the Commercial Banking & Credit Analyst (CBCA)™Program Page - CBCAGet CFI's CBCA™ certification and become a Commercial Banking & Credit Analyst. Enroll and advance your career with our certification programs and courses. certification program for those looking to take their careers to the next level. To keep learning and advancing your career, the following resources will be helpful:
- How To Read Stock ChartsHow to Read Stock ChartsIf you’re going to actively trade stocks as a stock market investor, then you need to know how to read stock charts. Even traders who primarily use fundamental analysis to select stocks to invest in still often use technical analysis of stock price movement to determine specific buy and sell, stock charting
- Kaufman’s Adaptive Moving Average (KAMA)Kaufman’s Adaptive Moving Average (KAMA)Kaufman’s Adaptive Moving Average (KAMA) was developed by American quantitative financial theorist, Perry J. Kaufman, in 1998. The technique began in 1972 but Kaufman officially presented it to the public through his book, "Trading Systems and Methods." Unlike other moving averages
- Point and Figure (P&F) ChartPoint and Figure (P&F) ChartA Point and Figure (P&F) chart is made up of multiple columns of X's that represent increases in a stock's price and O's that represent decreases in price. A column of X's is always followed by a column of O's and vice-versa. The chart is composed of multiple boxes
- Technical Analysis – A Beginner’s GuideTechnical Analysis - A Beginner's GuideTechnical analysis is a form of investment valuation that analyses past prices to predict future price action. Technical analysts believe that the collective actions of all the participants in the market accurately reflect all relevant information, and therefore, continually assign a fair market value to securities.
-
Understanding Offering Price: A Guide for Investors
The offering price is the per share price of publicly issued securities set by an underwriter and at which the shares are available for purchase. Although the term is mostly used in the context of the
-

Understanding Quoted Prices: A Comprehensive Guide
The quoted price is the most recent – or last – price at which a financial assetFinancial AssetsFinancial assets refer to assets that arise from contractual agreements on future cash flows
invest
- Understanding the Exponential Moving Average (EMA): Formula & Calculation
- Exponential Moving Average (EMA): Definition & Trading Applications
- Understanding Average Selling Price (ASP): Definition & Calculation
- Double Exponential Moving Average (DEMA): A Trading Guide
- KAMA: Understanding Kaufman's Adaptive Moving Average for Trading
- Qstick Indicator: Definition, Calculation & Trading Strategies
- Simple Moving Average (SMA): A Comprehensive Guide for Investors
- Weighted Moving Average (WMA): Definition, Calculation & Trading Strategies
- Exponential Moving Average (EMA): A Comprehensive Guide
-
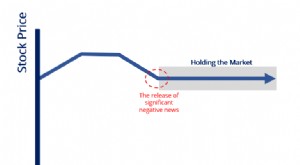 Understanding Market Support: What is 'Holding the Market'?
Holding the market refers to a market participant (or participants) that places or maintains buy orders for a security whose price is expected to fall rapidly – or is in the process of – t...
-
 MACD Oscillator: Understanding & Trading Strategies
The Moving Average Convergence Divergence (MACD) oscillator is one of the most popular and widely used technical analysis indicators that tradersEquity TraderAn equity trader is someone who ...