Qstick Indicator: Definition, Calculation & Trading Strategies
The Qstick indicator, developed by Tushar Chande, is a technical momentum indicator used to identify a stock’s trend by looking at the moving average of the difference between a stock’s closing and opening price. To generate insight, the Qstick indicator is generally calculated over a specified period of time.
Summary
- The Qstick indicator is a technical momentum indicator used to identify a stock’s trend by looking at the moving average of the difference between a stock’s closing and opening price.
- A Qstick indicator > 0 indicates increasing buying pressure, and a Qstick indicator < 0 indicates increasing selling pressure.
- The calculation of the Qstick indicator requires the following parameters: (1) Chart time frame, (2) Moving average length, and (3) Type of moving average.
Calculation of the Qstick Indicator
The calculation of the Qstick indicator depends on the desired chart time frame, moving average length, and type of moving averageMoving AverageA moving average is a technical indicator that market analysts and investors may use to determine the direction of a trend. It sums up the data points.
- Chart time frame: A commonly used time frame is daily. However, it is not uncommon to use time frames such as one minute or weekly.
- Moving average length: A shorter moving average length is better suited for short-term traders, while a longer moving average length is better suited for long-term investors. It is due to the lag associated with a longer moving average length.
- Type of moving average: Types of moving averages include simple moving average (SMA), exponential moving average (EMA)Exponential Moving Average (EMA)The Exponential Moving Average (EMA) is a technical indicator used in trading practices that shows how the price of an asset or security changes over a, smoothed moving average (SMMA), and linear weighted moving average (LWMA).
The Qstick indicator is calculated by taking an “n” period moving average of the difference between the closing and opening prices of a stock. The calculation of the indicator is best understood through an example, as provided below.
Example of the Qstick Indicator
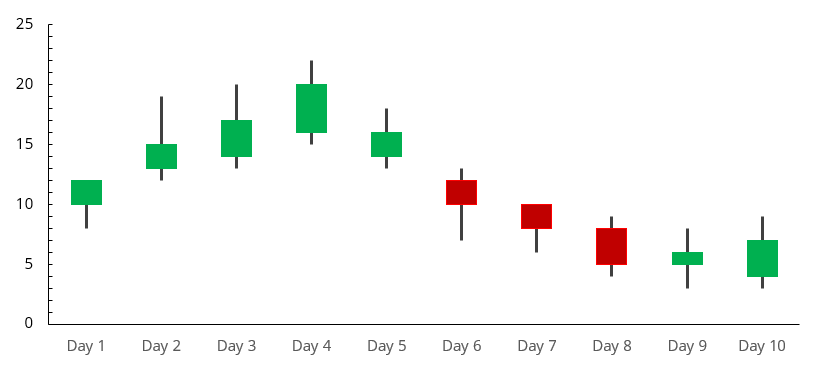
The following shows the daily candlesticks and associated dataset for Stock A:
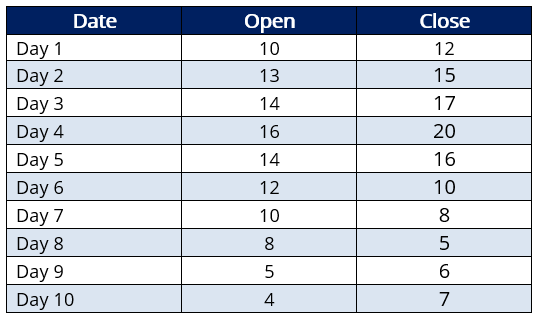
Below, we will calculate the two-day simple moving average for Stock A. As such, the key parameters for our Qstick indicator:
- Chart time frame is daily.
- Moving average length is two days.
- The type of moving average is a simple moving average.
The construction of the Qstick indicator is provided below:
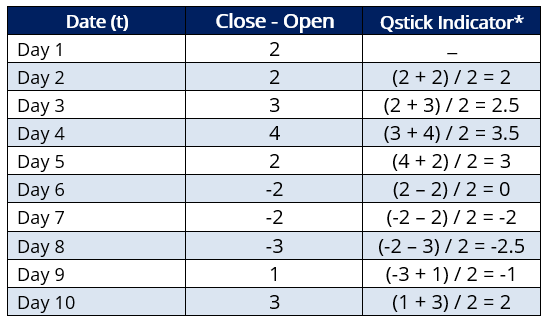
*Given a simple moving average length of two days, calculation of the Qstick indicator on “t” day would be ([Close-Open]t + [Close – Open]t-1) / 2. For illustrative purposes, if we change the simple moving average length to four days, calculation of the Qstick indicator on “t” day would be ([Close-Open]t + [Close – Open]t-1 + [Close – Open]t-2 + [Close – Open]t-3) / 4
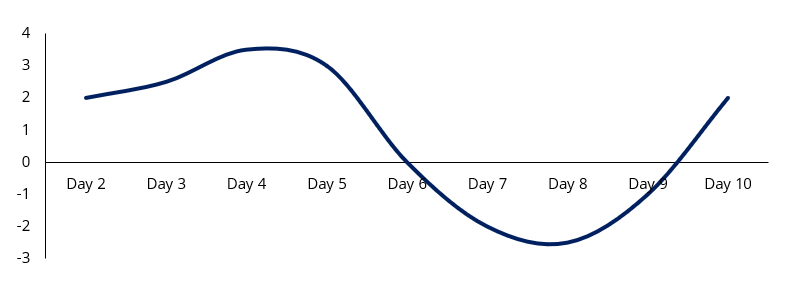
Plotting the values of the Qstick indicator would yield the following chart, which is commonly used in technical analysis:
Interpreting the Qstick Indicator
After seeing how the Qstick indicator is calculated, how do you interpret it?
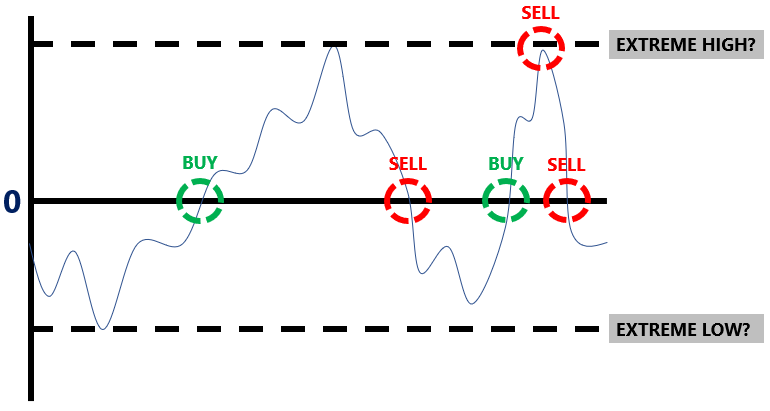
In technical analysisTechnical Analysis - A Beginner's GuideTechnical analysis is a form of investment valuation that analyses past prices to predict future price action. Technical analysts believe that the collective actions of all the participants in the market accurately reflect all relevant information, and therefore, continually assign a fair market value to securities., a Qstick indicator > 0 indicates increasing buying pressure, and a Qstick indicator < 0 indicates increasing selling pressure. Through plotting the Qstick indicator, trends can be identified. As such:
- Crossing above zero provides a BUY signal.
- Crossing below zero provides a SELL signal.
Furthermore, it is common for traders to identify extreme highs and lows of a Qstick indicator plot to identify entry/exit points:
- When the Qstick indicator is reversing off of an extreme high, it is a signal to SELL, and when the Qstick indicator is reversing off an extreme low, it is a signal to BUY.
Lastly, divergences can be spotted by comparing the Qstick indicator with the associated stock price.
- When the Qstick indicator is increasing, but the stock price is decreasing, it is a signal to BUY, and when the Qstick indicator is decreasing, but the stock price is increasing, it is a signal to SELL.
Although the Qstick indicator can provide BUY and SELL signals, it is not advised to base a trading decision solely on the technical indicator. Other indicators (such as the MACDMACD Oscillator - Technical AnalysisThe MACD Oscillator is used to examine short-term moving average convergence and divergence. The MACD Oscillator is a double-edged technical indicator in that it offers traders and analysts the ability to follow trends in the market, as well as gauge the momentum of price changes., RSI, Klinger Volume Oscillator) should be used in conjunction with the Qstick indicator.
Learn More
CFI offers the Capital Markets & Securities Analyst (CMSA)®Program Page - CMSAEnroll in CFI's CMSA® program and become a certified Capital Markets &Securities Analyst. Advance your career with our certification programs and courses. certification program for those looking to take their careers to the next level. To keep learning and developing your knowledge base, please explore the additional relevant resources below:
- Advanced Technical AnalysisAdvanced Technical AnalysisAdvanced technical analysis usually involves using either multiple technical indicators or a rather sophisticated (i.e., complex) indicator. "Sophisticated"
- Momentum IndicatorsMomentum IndicatorsMomentum indicators are tools utilized by traders to get a better understanding of the speed or rate at which the price of a security changes. Momentum
- Relative Strength Index (RSI)Relative Strength Index (RSI)The Relative Strength Index (RSI) is one of the most popular and widely used momentum oscillators. It was originally developed by the famed mechanical engineer turned technical analyst, J. Welles Wilder. The RSI measures both the speed and rate of change in price
- Speed LinesSpeed Lines - Technical AnalysisSpeed lines are an analysis tool used to determine support and resistance levels. They are not intended to be used as a standalone technical indicator.
-

Dow Jones Industrial Average (DJIA): Definition & Significance
The Dow Jones Industrial Average (DJIA), also commonly referred to as “the Dow Jones” or simply “the Dow,” is one of the most popular and widely-recognized stock market indices
-

KAMA: Understanding Kaufman's Adaptive Moving Average for Trading
Kaufman’s Adaptive Moving Average (KAMA) was developed by American quantitative financial theorist Perry J. Kaufman in 1998. The technique began in 1972 but Kaufman officially presented it to th
invest
- Average True Range (ATR): Understanding Volatility & Trading
- Double Exponential Moving Average (DEMA): A Trading Guide
- Exponential Moving Average (EMA): Definition & Trading Uses
- Exponentially Weighted Moving Average (EWMA): Definition & Applications
- Fast Stochastic Indicator: Definition, Calculation & Trading Strategies
- Fractal Indicator: Identify Trend Reversals in Trading
- Harvard MBA Indicator: A Guide to Investment Opportunities
- Vortex Indicator (VI): A Comprehensive Guide for Trend Analysis
- Weighted Moving Average (WMA): Definition, Calculation & Trading Strategies
-
 McGinley Dynamic Indicator: A Reliable Market Trend Signal
The McGinley Dynamic is a little-known yet highly reliable indicator invented by John R. McGinley, a chartered market technician and former editor of the Market Technicians Associations Journal of T...
-
 Understanding Average Annual Growth Rate (AAGR): Definition & Uses
The average annual growth rate (AAGR) is the average annual appreciation in the value of an investment asset, portfolio, or cash flow. It is determined by taking the numerical mean of specified or cal...