Understanding Average Inventory: Definition & Calculation
The average inventory is the mean value (that can be different from the median value) of an inventory during a determined period of time. The average inventory is thus a mathematical calculation. It estimates, on average, the value or the number of goods stored.
Below is the formula to calculate the average inventory:
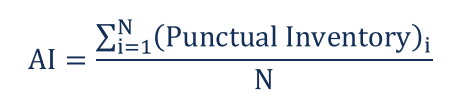
Where:
- AI is the average inventory
- N is the number of time periods
What is Inventory?
Before explaining what the average inventory is used for and its benefits, let us give a basic definition of inventory. Inventory is the total of all the goods ready to be sold and all the raw material stored in the warehouse of a given company.
Understanding Average Inventory
Usually, the inventory balance is measured on the last business day of each month. Thus, the average inventory is usually calculated for a time longer than one month, like a trimester or a yearFiscal Year (FY)A fiscal year (FY) is a 12-month or 52-week period of time used by governments and businesses for accounting purposes to formulate annual. The punctual inventory is referred to as the inventory balance corresponding to each month.
The average inventory can be used for different purposes. The two most common usages are related to the comparison of sales or revenue.
On the one hand, comparing the average inventory of two different periods can show fluctuations due to an increase or a decline in sales. On the other hand, the average inventory helps understand the level of inventory the company needs to invest in to generate certain revenues.
Moreover, keeping track of the average inventory helps the company see if it incurred losses in the raw material or the stored goods due to inaccuracy, theftInventory ShrinkageInventory shrinkage occurs when the number of products in stock are fewer than those recorded on the inventory list. The discrepancy may, or warehouse accidents.
Drawbacks of Average Inventory
In the previous paragraph, we saw how the average inventory could be useful in many circumstances; however, it comes with a few drawbacks.
Using an average estimation instead of a punctual one, you may not detect high volatility, which is important to eliminate (i.e., running out of inventory). For example, common practice allows the calculation to be based on a month-end inventory balance, but it can be very different if calculated on a day-end inventory balance.
Another problem arises if the average inventory is used to calculate the business trend in the year-to-date calculation. If the sales are seasonal, it can lead to a skewed distribution that can be misleading.
Lastly, there is a problem in common practice. Most of the time, the month-end inventory value is estimated instead of measured. Estimated values can come with errors that will be reported and amplified in calculating the average inventory.
It is necessary to keep in mind all these pitfalls every time we use the average inventory data.
Practical Example
The owner of a local supermarket wants to see if the average inventory of the first semester in 2019 is consistent with the average inventory calculated for the first quarter of the year. The average inventory for the first quarter was $10,000. It means that, on average, the value stored in the supermarket warehouse in January 2019 was $10,000. The same value applied for February 2019 and March 2019.
If we want to calculate the average inventory for the first semester, we need the month-end inventory for April, May, and June 2019. The warehouse manager registered the following value:
- April 2019: $12,000
- May 2019: $7,000
- June 2019: $11,000
If we apply the formula, the average inventory for the first semester results to be:

The average inventory calculated for the semester is the same as the one calculated for the first quarter of the year. It means that the sales are quite stable and that the volatility is very low.
Related Readings
In order to help you become a world-class financial analyst and advance your career to your fullest potential, these additional resources will be very helpful:
- Cost of Goods Sold (COGS)Cost of Goods Sold (COGS)Cost of Goods Sold (COGS) measures the “direct cost” incurred in the production of any goods or services. It includes material cost, direct
- Days Inventory Outstanding (DIO)Days Inventory OutstandingDays inventory outstanding (DIO) is the average number of days that a company holds its inventory before selling it. The days inventory
- Assemble-to-OrderAssemble-to-OrderAssemble-to-Order is a manufacturing strategy under which the manufacturer stocks up on sub-assembly parts and inventories and assembles the parts into the
- Products and ServicesProducts and ServicesA product is a tangible item that is put on the market for acquisition, attention, or consumption while a service is an intangible item, which arises from
-
Average Social Security Benefit in May 2021: A Detailed Breakdown
Social Security offers a monthly benefit check to many kinds of recipients. As of May 2021, the average check is $1,430.73, according to the Social Security Administration – but that amount ca
-

Average Cost Inventory Valuation: A Simple Guide
The average cost inventory valuation method is one way that many companies choose to evaluate their company inventory. This method is very simple to calculate and is preferred by many companies
Accounting
- Inventory Turnover Ratio: Definition & Calculation
- Average True Range (ATR): Understanding Volatility & Trading
- Understanding Inventory Age: A Key Metric for Business Efficiency
- Understanding Average Collection Period: A Key Metric for Businesses
- Periodic Inventory System: Definition, Pros & Cons
- Perpetual Inventory System: Definition, Benefits & How It Works
- Specific Identification Method: A Comprehensive Guide for Inventory Valuation
- Weighted Average Cost (WAC): Definition & Calculation
- Average Vacation Cost: A Comprehensive Breakdown for 2024
-
 Weighted Moving Average (WMA): Definition, Calculation & Trading Strategies
The weighted moving average (WMA) is a technical indicator that traders use to generate trade direction and make a buy or sell decision. It assigns greater weighting to recent data points and less wei...
-
 Understanding Average Daily Rate (ADR): A Key Hospitality Metric
The average daily rate (ADR) is a performance indicator used in the hospitality sector to measure the strength of revenues generated. It is measured as the total revenues generated by all the occupied...