Long-Term Investing: Why Buy & Hold Often Wins
There are two rules of thought when it comes to investing: buy and hold for the long-term or trade in and out of funds based on which funds are performing well and the direction of the economy. Arguments can be made for both sides and a simple internet search will yield millions of these results. I have always preached about the benefits of buy and hold investing. In order to be successful, you need to keep you costs low, have a financial plan for the long-term and be diversified. In this post, we are going to look at what impact time has on our investment portfolio through the use of historical returns.
A Look at Historical Returns
For the basis of this post, I am not going to talk about frequent trading versus buy and holding investing. I’ve already talked about how the average investor only sees a 2% annual return from jumping in an out of the market, which is the same as trading.
- Read now: Click here to see the best short term investments with great returns
I am only focusing on buy and hold investing. Let’s start off with a great chart I drew (the Christmas colors were not intended) that shows the annualized historical returns of stocks for one, five, ten and twenty rolling year periods, from 1950 through 2012.
Over the course of the 20 years, your annual average total return would be roughly 11% (not shown). That is fantastic! But let’s look at the chart in detail. The bar to the left shows you how much stocks fluctuate in a given one year period. Stocks can experience growth of 51% or a decline of 37%. Talk about volatile!
As we move along to the right, we see that for a five year period, the range of returns for stocks shrinks to a high of 28% and a low of negative 2%. When we move all the way to the right we see the range of returns drops even more, with a high of 18% and a low of 6%.
But what exactly does this tell us? The historical returns tell us the one thing that most investors fail to remember: over the short-term, the stock market is going to be a bumpy ride. But over the long-term, the ride is less bumpy and the general trend is upward.
This is evident in the graph: in any one year period, you can potentially gain 51% or lose 37% of your investment. But, over the course of 20 years, odds are you are going to return a profit and much of the volatility will subside.
Some of you reading this might see that one year return and have heart palpitations. You want to invest in the stock market, but cannot handle that much variance. I have great news for you.
Historical Returns: Diversification
As I previously wrote, in order to be a successful investor, you need to have a diversified portfolio. The historical returns chart I show above is only stocks. Let’s look at the historical returns if we put together a portfolio that is made up of 50% stocks and 50% bonds.
Right off the bat, we see that we decreased the one year volatility of returns. The range is now a return of 32% to a loss of 15%. When you move all the way to the right, to the 20 year rolling period, your returns range between 5 and 14%.
One important note about this is to not assume that a 50/50 portfolio will return the same as a 100% stock portfolio over 20 years. This just shows the range of returns that can be expected. Each portfolio will return somewhere in the range listed. In fact, the 50/50 portfolio has an average annual total return of roughly 9% (not shown) which is less than the stock portfolio of 11% mentioned earlier.
- Read now: Click here to learn why you need to ignore Dave Ramsey’s investing advice
You may wonder what this means in terms of dollars. Let’s say you had $200,000 and invested half in each portfolio for 20 years. How would you have fared?
- 100% Stocks: $782,750
- 50/50 Portfolio: $554,550
The difference is close to $230,000 over the 20 years. This just shows you that the less volatile portfolio will return less than the 100% stock portfolio. This is to be expected since you lowered the risk you were willing to take by investing in the 50/50 portfolio (remember, risk and return are related!).
Final Thoughts
There will always be short-term volatility in the market. Unfortunately you cannot completely eliminate volatility; you can only tune it out. If you have a financial plan and nothing has changed in that plan, meaning your investment allocation is correct, then you need to ignore the noise if you want to be successful. If you give into the noise, you will most likely lose money, while the best case scenario is you will earn the 2% that the average investor earns that I mentioned earlier. Take the steps needed to turn off that noise so that you can achieve financial success.
- Read now: Learn if you should invest in target date funds
- Read now: Discover the basics to investing for success
-

Understanding the Equity Premium Puzzle: A Deep Dive
The Equity Premium Puzzle (EPP) refers to the fact that stocks have outperformed Treasury bonds by an extraordinarily high margin over the last century – a margin so high that it is very difficu
-

Modern Portfolio Theory (MPT): Maximize Returns, Minimize Risk
The Modern Portfolio Theory (MPT) refers to an investment theory that allows investors to assemble an asset portfolio that maximizes expected return for a given level of risk. The theory assumes that
invest
- Understanding the Enduring Value of Paper Money
- Understanding the Essential Role of Money in Society
- Portfolio Investment: Diversify for Risk Reduction & Growth
- Understanding Portfolio Active Return: Definition & Calculation
- Understanding Historical Returns: A Guide for Investors
- Portfolio Turnover Ratio: Definition, Calculation & Significance
- Understanding Optimal Portfolio Theory: A Beginner's Guide
- Marketing vs. Sales: Understanding the Key Differences
- Investment Diversification: Reduce Risk & Maximize Returns
-
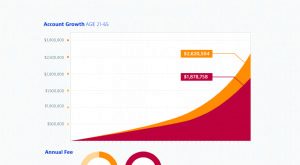 Investment Fees: How They Impact Your Returns
The median price of a home in the United States was recently reported by the U.S. Census Bureau to be $319,700 (including the land on which the home sits). So what exactly does this number have to do ...
-
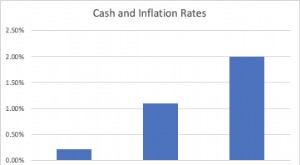 Cash Investing: Risks & Rewards - A Comprehensive Guide
Cash appears to be a safe investment to many investors. And that is true in a sense, the nominal value of your savings will not go down if you hold cash. But some investors use it in a way that detrac...