Modern Portfolio Theory (MPT): Maximize Returns, Minimize Risk
The Modern Portfolio Theory (MPT) refers to an investment theory that allows investors to assemble an asset portfolio that maximizes expected return for a given level of risk. The theory assumes that investors are risk-averse; for a given level of expected return, investors will always prefer the less risky portfolio.

Hence, according to the Modern Portfolio Theory, an investor must be compensated for a higher level of risk through higher expected returns. MPT employs the core idea of diversification – owning a portfolio of assets from different classes is less risky than holding a portfolio of similar assets.
Diversification
Diversification is a portfolio allocation strategy that aims to minimize idiosyncratic riskIdiosyncratic RiskIdiosyncratic risk, also sometimes referred to as unsystematic risk, is the inherent risk involved in investing in a specific asset – such as a stock – the by holding assets that are not perfectly positively correlated. Correlation is simply the relationship that two variables share, and it is measured using the correlation coefficient, which lies between -1≤ρ≤1.
- A correlation coefficient of -1 demonstrates a perfect negative correlation between two assets. It means that a positive movement in one is associated with a negative movement in the other.
- A correlation coefficient of 1 demonstrates a perfect positive correlation. Both assets move in the same direction in response to market movements.
A perfect positive correlation between assets within a portfolio increases the standard deviation/risk of the portfolio. Diversification reduces idiosyncratic risk by holding a portfolio of assets that are not perfectly positively correlated.
For example, suppose a portfolio consists of assets A and B. The correlation coefficient for A and B is -0.9. The figure shows a strong negative correlationNegative CorrelationA negative correlation is a relationship between two variables that move in opposite directions. In other words, when variable A increases, variable B decreases. A negative correlation is also known as an inverse correlation. See examples, charts and – a loss in A is likely to be offset by a gain in B. It is the advantage of owning a diversified portfolio.
Does Diversification Eliminate Risk?
- The idiosyncratic risk associated with the portfolio is lower or negligible if it’s diversified. It is because any loss in one asset is likely to be offset by a gain in another asset (which is negatively correlated).
- Systematic riskSystematic RiskSystematic risk is that part of the total risk that is caused by factors beyond the control of a specific company or individual. Systematic risk is caused by factors that are external to the organization. All investments or securities are subject to systematic risk and therefore, it is a non-diversifiable risk. refers to the risk that is common to the entire market, unlike idiosyncratic risk, which is specific to each asset. Diversification cannot lower systematic risk because all assets carry this risk.
Portfolios can be diversified in a multitude of ways. Assets can be from different industries, different asset classes, different markets (i.e., countries), and of different risk levels. The key to a diversified portfolio is holding assets that are not perfectly positively correlated.
Portfolio Frontier
According to the Modern Portfolio Theory, a portfolio frontier, also known as an efficient frontier, is a set of portfolios that maximizes expected returns for each level of standard deviation (risk). A typical portfolio frontier is illustrated below:

Expected Return
The expected return of a portfolio is the expected value of the probability distribution of the possible returns it can provide to investors.
Consider an investor holds a portfolio with $4,000 invested in Asset Z and $1,000 invested in Asset Y. The expected return on Z is 10% ,and the expected return on Y is 3%. The expected return of the portfolio is:
Expected Return = [($4,000/$5,000) * 10%] + [($1,000/$5,000) * 3%] = [0.8 * 10%] + [0.2 * 3%] = 8.6%
Standard Deviation
Standard deviation measures the level of risk or volatility of an asset. It is used to determine how widely spread out the asset movements are over time (in terms of value). Assets with a wider range of movements carry higher risk.
The standard deviation of a portfolio depends on:
- The standard deviation of each asset in the portfolio.
- The weights of each asset
- The correlation between each asset.
Further information on how to calculate portfolio standard deviation can be found in CFI’s Portfolio Variance articlePortfolio VariancePortfolio variance is a statistical value that assesses the degree of dispersion of the returns of a portfolio. It is an important concept in modern investment theory. Although the statistical measure by itself may not provide significant insights, we can calculate the standard deviation of the portfolio using portfolio variance..
Risk-Free Rate
The risk-free rate refers to the rate of return an investor expects to earn on an asset with zero risk. All assets carry some degree of risk; therefore, assets that generally have low default risks and fixed returns are considered risk-free. An example of a risk-free asset is a 3-month government Treasury bill.
Efficient Frontier
The upper portion of the curve (point A onwards) is the “efficient frontier” – it is the combination of risky-assets that maximizes expected return for a given level of standard deviation. Therefore, any portfolio on this portion of the curve offers the best possible expected returns for a given level of risk.
- Point “A” on the efficient frontier is the minimum variance portfolio –
the combination of risky-assets that minimizes standard deviation/risk. - Point “B” is the optimal market portfolio, which consists of at least one risk-free asset. It is depicted by the line that is tangent to the efficient frontier, which is also called the Capital Allocation Line (CAL).
Capital Allocation Line (CAL)
The Capital Allocation Line (CAL) is a line that depicts the risk-reward tradeoff of assets that carry idiosyncratic risk. The slope of the CAL is called the Sharpe ratio, which is the increase in expected return per additional unit of standard deviation (reward-to-risk ratio).
In the chart above, at point “B,” the reward-to-risk ratio (the slope of the CAL) is the highest, and it is the combination that creates the optimal portfolio according to the MPT.
Further information on how to calculate the efficient frontier and capital allocation line can be found in CFI’s Capital Allocation Line (CAL) and Optimal Portfolio articleCapital Allocation Line (CAL) and Optimal PortfolioStep by step guide to constructing the portfolio frontier and capital allocation line (CAL). The Capital Allocation Line (CAL) is a line that graphically depicts the risk-and-reward profile of risky assets, and can be used to find the optimal portfolio..
According to the MPT, rational risk-averse investors should hold portfolios that fall on the efficient frontier (since they provide the highest possible expected returns for a given level of standard deviation). The optimal portfolio (also called the “market portfolio”) is the combination of assets at point “B,” which combines one risk-free asset with one risky asset.
Key Takeaways
The Modern Portfolio Theory focuses on the relationship between assets in a portfolio in addition to the individual risk that each asset carries. It exploits the fact that a negatively correlated asset offsets losses that are incurred on another asset. For example, crude oil prices and airline stock prices are negatively correlated.
A portfolio with a 50% weight in crude oil and 50% weight in an airline stock is safe from the idiosyncratic risk carried by each of the individual assets. When oil prices decline, the airline stock prices are likely to increase, offsetting the losses incurred from the oil stock.
Related Readings
CFI offers the Commercial Banking & Credit Analyst (CBCA)™Program Page - CBCAGet CFI's CBCA™ certification and become a Commercial Banking & Credit Analyst. Enroll and advance your career with our certification programs and courses. certification program for those looking to take their careers to the next level. To keep learning and developing your knowledge base, please explore the additional relevant resources below:
- Asset ClassAsset ClassAn asset class is a group of similar investment vehicles. They are typically traded in the same financial markets and subject to the same rules and regulations.
- CorrelationCorrelationA correlation is a statistical measure of the relationship between two variables. The measure is best used in variables that demonstrate a linear relationship between each other. The fit of the data can be visually represented in a scatterplot.
- Expected ReturnExpected ReturnThe expected return on an investment is the expected value of the probability distribution of possible returns it can provide to investors. The return on the investment is an unknown variable that has different values associated with different probabilities.
- Sharpe RatioSharpe RatioThe Sharpe Ratio is a measure of risk-adjusted return, which compares an investment's excess return to its standard deviation of returns. The Sharpe Ratio is commonly used to gauge the performance of an investment by adjusting for its risk.
-

REIT Investing Risks: Understanding Potential Downsides
In this article, learn about the different risk factors of investing in REITs. Real estate investment trusts (REITs) refer to investment equities that investors invest in to increase the returns on th
-

Larry Portfolio: A Simple, Diversified Investing Strategy Explained
Recently, I wrote a three-part series on how to start investing. Today, I want to look at an advanced topic. Generally, I avoid advanced topics in investing, for two reasons: 1. Most peop
invest
- Understanding Portfolio Active Return: Definition & Calculation
- Darvas Box Strategy: A Beginner's Guide to Profitable Trading
- Understanding the Greater Fool Theory: Market Valuation & Irrational Exuberance
- Local Expectations Theory: Understanding Bond Yields & Term Structure
- Portfolio Turnover Ratio: Definition, Calculation & Significance
- Limitations of Modern Portfolio Theory: Understanding Its Shortcomings
- Modern Portfolio Theory (MPT): A Comprehensive Overview
- Modern Portfolio Theory (MPT): A Beginner's Guide
- Modern Portfolio Theory (MPT): A Comprehensive Overview
-
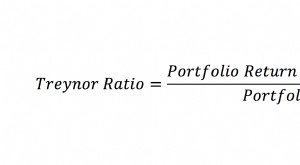 Treynor Ratio: Understanding Risk-Adjusted Portfolio Performance
The Treynor Ratio is a portfolio performance measure that adjusts for systematic riskSystematic RiskSystematic risk is that part of the total risk that is caused by factors beyond the control of a spe...
-
 Understanding the Liquidity Preference Theory: A Comprehensive Explanation
The Theory of Liquidity Preference states that agents in financial markets demonstrate a preference for liquidity. Formally, if U(Asset A) > U(Asset B) and rA = rB, then L(Asset A) > ...