Navigating Market Volatility: A Look Back at Last Week's Historic Events
There is a quote widely attributed to Vladimir Lenin: “There are decades where nothing happens, and there are weeks where decades happen.”
Last week was one of those weeks where decades happened.
Near-unprecedented volatility in stocks, a historic move in oil, and the total shutdowns of major industries global economies have put everybody on edge as the COVID-19 virus continues to spread.
As Portfolio Manager and blogger Eddy Elfenbein noted on Friday, “Of the last 10 years, this week the S&P 500 posted its:
- Monday: 2nd Worst
- Tuesday: 2nd Best
- Wednesday: 3rd Worst
- Thursday: Worst
- Friday: Best”
That kind of whipsaw action in the market is nearly unheard of.
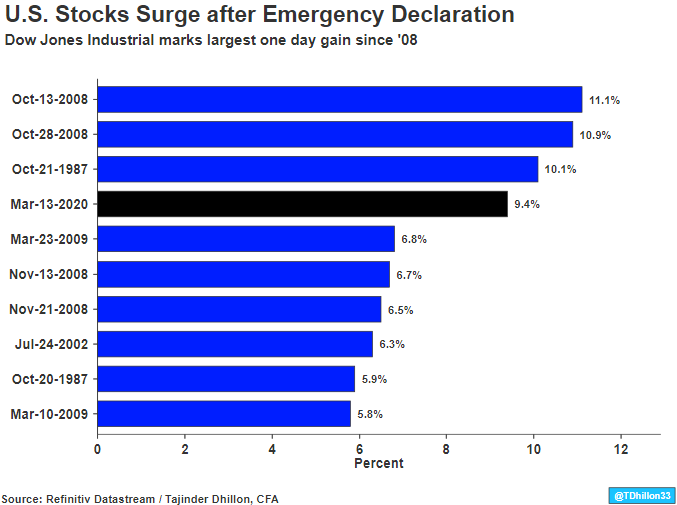
As a microcosm of the craziness, look no further than Friday’s close. Buoyed by a speech in which President Trump declared a National Emergency and touted the assistance of the private sector in helping to fight the pandemic, major indexes posted their largest single-day point gains in 12 years.
And yet by Sunday night, most of that optimism had vanished. An emergency decision by the Federal Reserve to lower interest rates to 0-0.25% and restart Quantitative Easing for the first time since the financial crisis sent a shock through markets. The S&P futures hit limit down just 14 minutes into the overnight session, erasing most of Friday’s gains in one fell swoop.
Where Does This Leave Us?
According to FactSet, the sell-off in stocks over the past few weeks has brought the S&P 500 forward P/E ratio to 14, the lowest it’s been since December 24, 2018 (readings below the historical average of 15 are extremely rare).
We are in a bear market now. This marks just the 13th time since the end of World War II that sentence can be said.
And there’s no way of knowing just how long this could last. In the previous 12 bear markets since WWII—defined as a period in which stocks fell more than 20% from their highs—the average length was 14 months.
If the projections are correct—and they’re virtually certain to be at least partially right—things are almost certainly going to get worse before they get better. That is as much true for the containment of COVID-19 as it is for economic conditions.
This leaves investors in the vulnerable position of trusting that things will get better, without knowing exactly when that could happen.
Jason Zweig put it nicely in his column on Friday: “Investing, now more than ever, is about controlling the controllable. You can’t control the markets. You can’t control the coronavirus. You can control your own behavior, although that requires making accurate, honest predictions about yourself.”
In a normal situation, you could say that we’ll never see a week like last week again. But these are unprecedented times. As crazy as the second week of March 2020 was, there’s a high probability that the coming weeks will be even crazier.
All we can really do is ride out this storm. Expect the unexpected. Be kind to your neighbor. And above all, stay safe. We’ll get through this.
Active Trading with Lightspeed
Lightspeed provides professional traders with all the tools required to help them find success in stock trading, and we have been developing and honing our active trader platform to offer an optimal user experience. With the intuitive interface layouts and institutional quality stock and options scanners, we aim to help traders reach their goals, no matter what their strategy is. We also offer our clients some of the lowest trading fees in the industry.
-

Understanding Implied Volatility (IV): A Comprehensive Guide
Implied volatility (IV) uses the price of an option to calculate what the market is saying about the future volatility of the option’s underlying stock. IV is one of six factors used in options
-
Understanding Volatility: A Key Indicator of Investment Risk
Volatility is a measure of the rate of fluctuations in the price of a securityMarketable SecuritiesMarketable securities are unrestricted short-term financial instruments that are issued eit
Stock trading
- Cryptocurrency Market Update: Bitcoin Up Slightly Despite Weekly Decline
- Bitcoin Volatility: Strategies to Profit from Market Swings
- Navigating Election Volatility: A Guide to Smart Stock Investing
- Grow Your Savings: A 5-Year Plan to Reach $7,000 from $25/Week
- Weekly Market Analysis: Navigating Volatility & Economic Uncertainty
- Market Update: US-China Trade, Syria & Fed Outlook Impact Stocks
- Market Volatility Alert: Understanding Recent Stock Selloff
- Top 5 Cryptocurrencies by Trading Volume This Week
- CDs: 3 Key Questions to Ask Before Investing
-
 Understanding Earnings Volatility: Risk & Stock Price Prediction
Earnings volatility is a statistical concept that determines the associated risk and helps predict the market price of a particular stock. Volatility is the risk related to different degrees of change...
-
 Understanding Historical Volatility (HV): A Comprehensive Guide
Historical volatility, or HV, is a statistical indicator that measures the distribution of returns for a specific security or market indexMarket IndexMarket index is a portfolio of securities that rep...