Understanding Historical Volatility (HV): A Comprehensive Guide
Historical volatility, or HV, is a statistical indicator that measures the distribution of returns for a specific security or market indexMarket IndexMarket index is a portfolio of securities that represent a section of the stock market, deriving its value from the values of its underlying securities over a specified period. The historical volatility of a security or other financial instrument in a given period is estimated by finding the average deviation of the instrument from its average price.
Historical volatility is normally computed by making use of standard deviationStandard DeviationFrom a statistics standpoint, the standard deviation of a data set is a measure of the magnitude of deviations between values of the observations contained. Securities or investment instruments that are riskier tend to show higher historical volatility.
Summary
- Historical volatility, or HV, is a statistical indicator that measures the distribution of returns for a specific security or market index over a specified period.
- The historical volatility of a security or other financial instrument in a given period is estimated by finding the average deviation of the instrument from its average price.
- Historical volatility is normally computed by making use of standard deviation. Securities or investment instruments that are riskier tend to show higher historical volatility.
Understanding Historical Volatility
Historical volatility is an indicator of the extent to which a price may diverge from its average in a given period. Hence, increased price fluctuation results in a higher historical volatility value. It is important to keep in mind that the historical volatility figure does not indicate the price direction but rather how unstable a price is.
Volatility is generally a measure of the riskiness of an investment. Increased volatility serves as an indication of increased uncertainty and risk. The opposite is also true; decreased volatility serves as an indication for lowered uncertainty and risk. As commonly expected in financial instrument trading, HV can be used along with other trading patterns, trends, and other indicators to identify instruments that they consider to be risky or highly volatile.
Historical volatility can be utilized as an instrument by traders who only trade underlying financial instruments. Measuring the instability of a market can impact the expectation of an investor on how much or to what extent the market may change and offers some guidance in making price forecasts and executing a trade.
A high volatility can imply a possible change of trend when aggressive buying/selling enters the market because the large transaction volumes will trigger notable price reversals.
Furthermore, historical volatility does not assess the probability of loss primarily, even though it can be used to provide an indication thereof.
HV can be used to assess by how much the price of a security shifts from its average value. In markets where a predominant trend exists, historical volatility provides an overview of the extent to which traded prices may have deviated from a central or moving average price. In smooth markets with a strong predominant trend, low volatility levels can be expected even though prices may fluctuate drastically as time passes.
The HV value does not change significantly on a daily basis, but the change occurs at a constant pace. To assess whether options may be undervalued or overvalued, the historical volatility and implied volatilityImplied Volatility (IV)Implied volatility – or simply IV – uses the price of an option to calculate what the market is saying about the future volatility of the are compared to one another. HV is a common measure in risk assessment and valuations.
Understanding Volatility
Volatility is a measurement of the frequency of financial asset price variations over time. This shows the potential risk levels associated with the price fluctuations of a security. The volatility of an asset is measured by investors and traders to analyze historical price fluctuations and forecast their possible movements.
Calculating Volatility
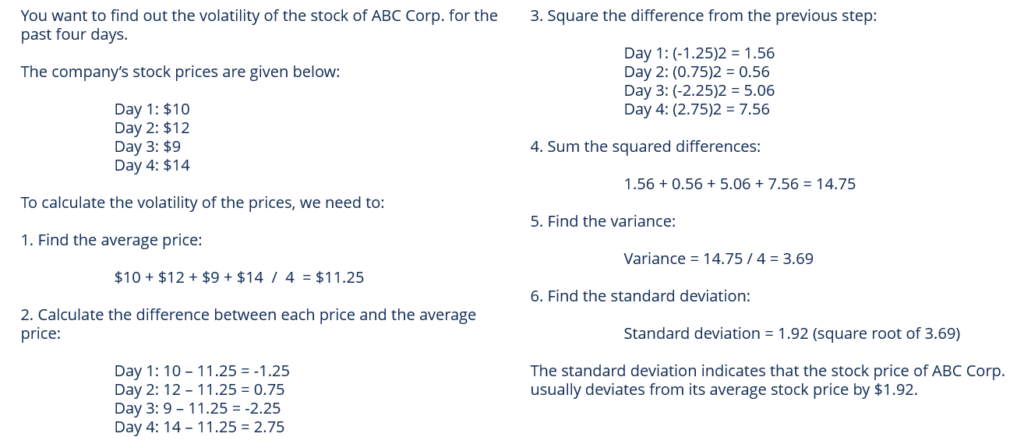
The following steps can be followed when calculating volatility through determining the standard deviation over time:
- Collect the historical prices for the asset.
- Compute the expected price (mean) of the historical prices.
- Work out the difference between the average price and each price in the series.
- Square the differences from the previous step.
- Determine the sum of the squared differences.
- Divide the differences by the total number of prices (find variance).
- Compute the square root of the variance computed in the previous step.
The image below illustrates an example of a volatility computation:
Implied Volatility
Implied volatility refers to the volatility of an underlying asset, which will return the theoretical value of an option equal to the option’s current market price. Implied volatility is a key parameter in option pricing. It provides a forward-looking aspect of possible future price fluctuations.
More Resources
CFI offers the Capital Markets & Securities Analyst (CMSA)™Program Page - CMSAEnroll in CFI's CMSA® program and become a certified Capital Markets &Securities Analyst. Advance your career with our certification programs and courses. certification program for those looking to take their careers to the next level. To keep learning and developing your knowledge base, please explore the additional relevant resources below:
- Rate of ReturnRate of ReturnThe Rate of Return (ROR) is the gain or loss of an investment over a period of time copmared to the initial cost of the investment expressed as a percentage. This guide teaches the most common formulas
- MeanMeanMean is an essential concept in mathematics and statistics. In general, a mean refers to the average or the most common value in a collection of
- Volume Price Trend IndicatorVolume Price Trend Indicator (VPT)The Volume Price Trend Indicator (VPT) is a stock market indicator that helps traders relate a stock's price and trading volume.
- VIXVIXThe Chicago Board Options Exchange (CBOE) created the VIX (CBOE Volatility Index) to measure the 30-day expected volatility of the US stock market, sometimes called the "fear index". The VIX is based on the prices of options on the S&P 500 Index
-

IRA CDs: Secure Retirement Savings with FDIC Insurance
An Individual Retirement Account, referred to as an IRA, offers tax advantages to help you save for retirement. An IRA acts like a basket to hold different types of investments and assets. One of the
-

Understanding the DU: Your Mortgage Approval Explained
DU in relation to a mortgage stands for Desktop Underwriter, which is a mortgage program used to analyze a borrower's application to see if it meets criteria set up by the governing agency of that
invest
- Understanding Earnings Volatility: Risk & Stock Price Prediction
- Understanding Historical Returns: A Guide for Investors
- Understanding Implied Volatility (IV): A Comprehensive Guide
- VIX Explained: Understanding the Stock Market Volatility Index
- Understanding Volatility: A Key Indicator of Investment Risk
- Volatility Arbitrage: A Deep Dive into Options Trading Strategies
- Volatility Ratio: Understanding Price Changes for Trading & Investing
- Understanding Volatility Skew: A Guide for Investors
- Volatility Smile Explained: Understanding Implied Volatility Patterns
-
PC Banking: A Comprehensive Guide to Online Banking Security & Features
PC banking refers to a person being able to access their banking information from a "personal computer." It has become a popular method for people to manage money and pay bills using online ...
-
 Understanding the VIX: A Comprehensive Guide to Market Volatility
Stocks are volatile. That much is understood by most investors, but what exactly is volatility and how is it measured for the overall market? You may have seen references to something called the VIX,...