Inventory Turnover Ratio: Definition & Calculation
The inventory turnover ratio, also known as the stock turnover ratio, is an efficiency ratio that measures how efficiently inventoryInventoryInventory is a current asset account found on the balance sheet, consisting of all raw materials, work-in-progress, and finished goods that a is managed. The inventory turnover ratio formula is equal to the cost of goods soldCost of Goods Sold (COGS)Cost of Goods Sold (COGS) measures the “direct cost” incurred in the production of any goods or services. It includes material cost, direct divided by total or average inventory to show how many times inventory is “turned” or sold during a period. The ratio can be used to determine if there are excessive inventory levels compared to sales.
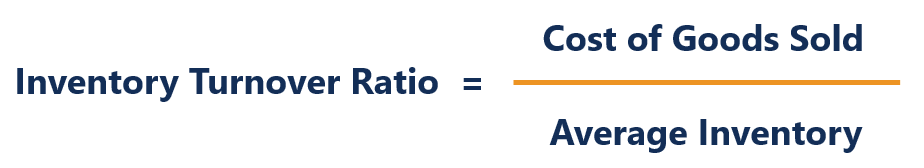
Inventory Turnover Ratio Formula
The formula for calculating the ratio is as follows:
Where:
- Cost of goods sold is the cost attributed to the production of the goods that are sold by a company over a certain period. The cost of goods sold by a company can found on the company’s income statementIncome StatementThe Income Statement is one of a company's core financial statements that shows their profit and loss over a period of time. The profit or.
- Average inventory is the mean value of inventory throughout a certain period. Note: an analyst may use either average or end-of-period inventory values.
Practical Example of Inventory Turnover Ratio
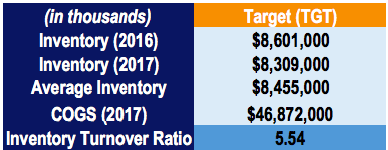
For example, Walmart Inc. (WMT) and Target Corporation reported the following figures in financial statements:
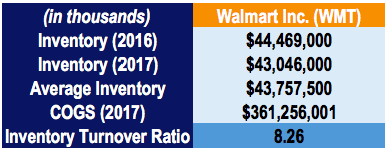
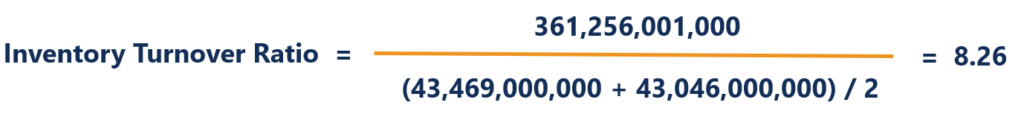
The ratio for Walmart is calculated as follows:
Likewise, the ratio for Target is calculated as follows:
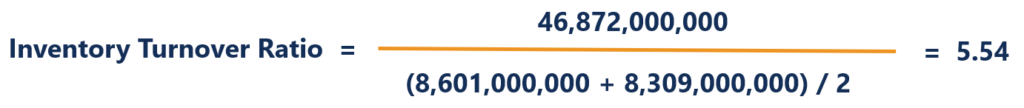
By comparing the inventory turnover ratios of Walmart and Target, two companies that operate mainly in the retail industry, we can see that Walmart sells its inventory 8.26x over a period of one year compared to Target’s 5.54x. It implies that Walmart can more efficiently sell the inventory it buys. In addition, it may show that Walmart is not overspending on inventory purchases and is not incurring high storage and holding costs compared to Target.
Interpretation of Inventory Turnover Ratio
Inventory turnover ratio is an efficiency ratio that measures how well a company can manage its inventory. It is important to achieve a high ratio, as higher turnover rates reduce storage and other holding costs. It is vital to compare the ratios between companies operating in the same industry and not for companies operating in different industries. The benchmark ratio varies greatly depending on the industry.
Low turnover implies that a company’s sales are poor, it is carrying too much inventory, or experiencing poor inventory management. Unsold inventory can face significant risks from fluctuating market prices and obsolescence.
Depending on the industry that the company operates in, inventory can help determine its liquidity. For example, inventory is one of the biggest assets that retailers report. If a retail company reports a low inventory turnover ratio, the inventory may be obsolete for the company, resulting in lost sales and additional holding costs.
Key Takeaways
- Inventory turnover ratio is an efficiency ratio that measures how efficiently inventory is managed.
- The ratio should only be compared for companies operating in the same industry, as the ratio varies greatly depending on the industry.
- A high ratio is always favorable, as it indicates reduced storage and other holding costs.
- A low ratio implies poor sales, excess inventory, or inefficient inventory management.
- Depending on the industry, the ratio can be used to determine a company’s liquidity.
More Resources
CFI offers the Financial Modeling & Valuation Analyst (FMVA)™Become a Certified Financial Modeling & Valuation Analyst (FMVA)®CFI's Financial Modeling and Valuation Analyst (FMVA)® certification will help you gain the confidence you need in your finance career. Enroll today! certification program for those looking to take their careers to the next level. To keep learning and advancing your career, the following CFI resources will be helpful:
- Days Inventory Outstanding (DIO)Days Inventory OutstandingDays inventory outstanding (DIO) is the average number of days that a company holds its inventory before selling it. The days inventory
- Day Sales Outstanding (DSO)Days Sales Outstanding (DSO)Days Sales Outstanding (DSO) represents the average number of days it takes credit sales to be converted into cash, or how long it takes a
- Comparable Company AnalysisComparable Company AnalysisThis guide shows you step-by-step how to build comparable company analysis ("Comps") and includes a free template and many examples.
- Financial Analysis Ratios GlossaryFinancial Analysis Ratios GlossaryGlossary of terms and definitions for common financial analysis ratios terms. It's important to have an understanding of these important terms.
-

Debt-to-Assets Ratio: Definition, Calculation & Risk Assessment
The Debt to Assets Ratio is a leverage ratioLeverage RatiosA leverage ratio indicates the level of debt incurred by a business entity against several other accounts in its balance sheet, income statem
-
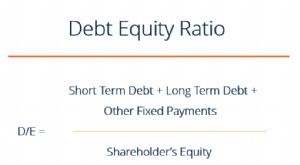
Debt-to-Equity Ratio: Definition, Calculation & Importance
The Debt to Equity ratio (also called the “debt-equity ratio”, “risk ratio”, or “gearing”), is a leverage ratioLeverage RatiosA leverage ratio indicates the le
finance
- Asset Turnover Ratio: Definition & Calculation - Financial Analysis
- Cash Turnover Ratio (CTR): Calculation & Interpretation
- Current Ratio: Definition, Calculation & Financial Health
- Inventory Turnover Ratio: Definition & Calculation | AccountingTools
- Operating Asset Turnover Ratio: Definition & Analysis
- Portfolio Turnover Ratio: Definition, Calculation & Significance
- Accounts Payable Turnover Ratio: Definition & Interpretation
- Accounts Receivable Turnover Ratio: Definition & Calculation
- Receivables Turnover Ratio: Definition, Calculation & Importance
-
 Advertising to Sales Ratio: Measuring Ad Effectiveness & ROI
The advertising to sales ratio, also called the “A to S” for short, measures the effectiveness, or how successful, a company’s advertising strategiesAIDA ModelThe AIDA model, which s...
-
 Understanding the CAPE Ratio: A Guide to Cyclically Adjusted P/E
The CAPE Ratio (also known as the Shiller P/E or PE 10 Ratio) is an acronym for the Cyclically-Adjusted Price-to-Earnings Ratio. The ratio is calculated by dividing a company’s stock price by th...