Contribution Margin Ratio: Formula, Calculation & Analysis
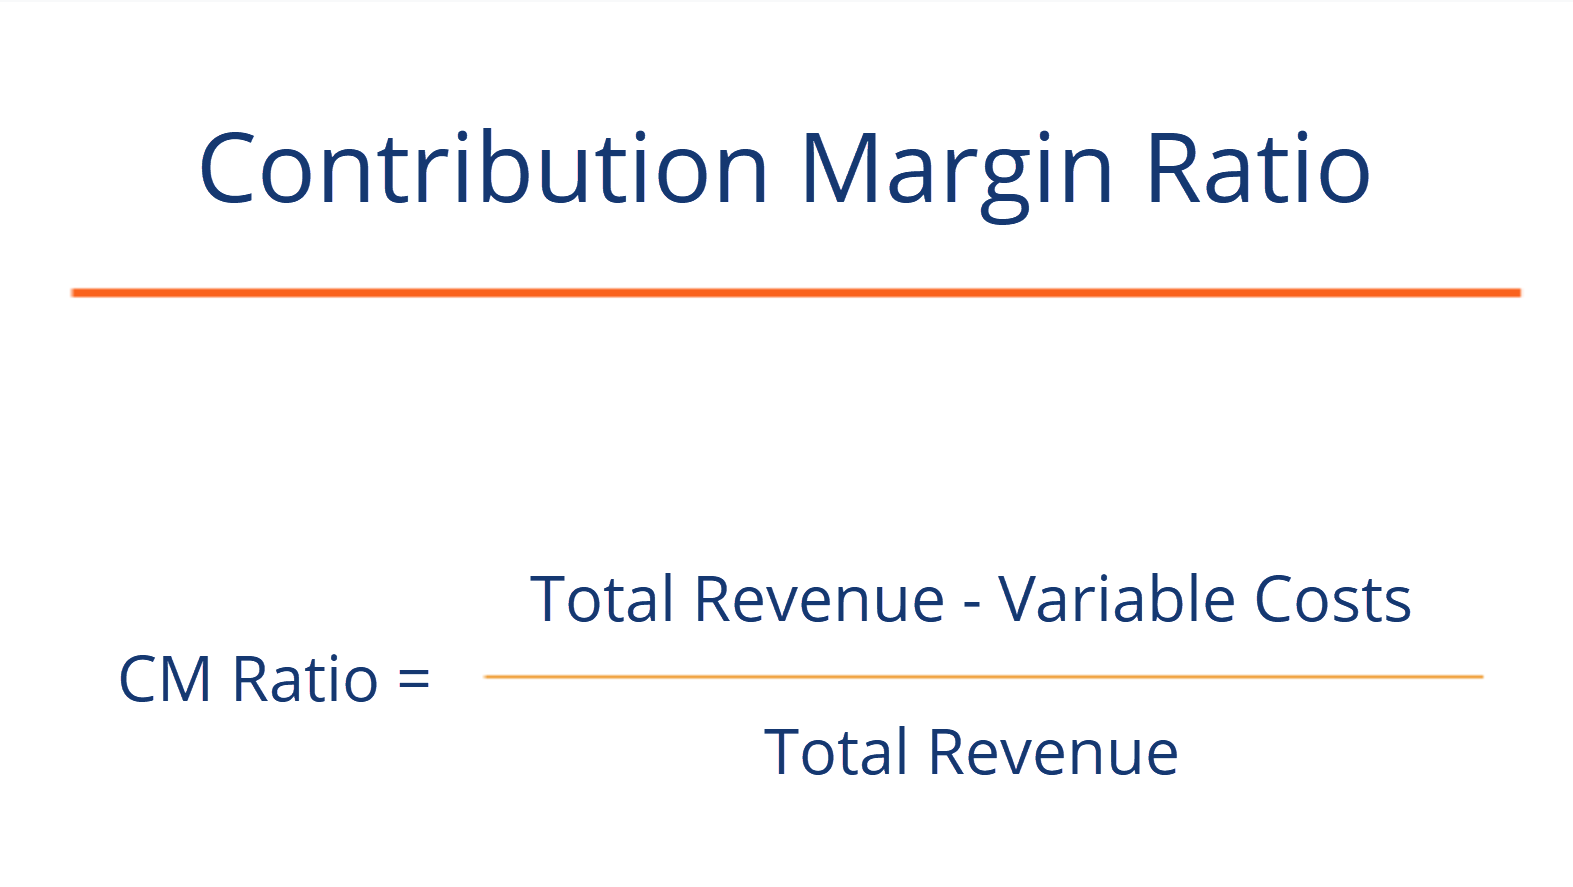
The contribution margin ratio (CM ratio) of a business is equal to its revenueSales RevenueSales revenue is the income received by a company from its sales of goods or the provision of services. In accounting, the terms "sales" and less all variable costsFixed and Variable CostsCost is something that can be classified in several ways depending on its nature. One of the most popular methods is classification according, divided by its revenue. It represents the marginal benefit of producing one more unit. Here is the formula for contribution margin ratio (CM ratio):
See an example in Excel here.
Example Calculation of Contribution Margin Ratio
CM ratio = (total revenue – cost of goods sold – any other variable expenses) / total revenue
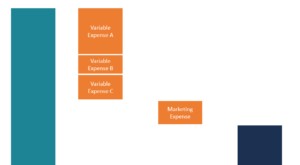
A company has revenues of $50 million, the cost of goods soldAccountingOur Accounting guides and resources are self-study guides to learn accounting and finance at your own pace. Browse hundreds of guides and resources. is $20 million, marketing is $5 million, product delivery fees are $5 million, and fixed costsFixed and Variable CostsCost is something that can be classified in several ways depending on its nature. One of the most popular methods is classification according are $10 million.
Contribution margin dollars = $50M – $20M – $5M – $5M = $20 million
Contribution margin ratio = $20M / $50M = 40%
The fixed costs of $10 million are not included in the formula, however, it is important to make sure the CM dollars are greater than the fixed costs, otherwise, the company is not profitable.
Breakeven Analysis
The contribution margin is not necessarily a good indication of economic benefit. Companies may have significant fixed costs that need to be factored in.
It can be important to perform a breakeven analysis to determine how many units need to be sold, and at what price, in order for a company to break even. To learn more, check out our Financial Analysis course.
In order to perform this analysis, calculate the contribution margin per unit, then divide the fixed costs by this number and you will know how many units you have to sell to break even.
Building on the above example, suppose that the company sold 1 million units. That means the CM per unit is $20. Fixed costs are $10 million so the company has to sell 500,000 units to break even ($10 million / $20 per unit = 500,000).
Download the Free Template
Enter your name and email in the form below and download the free template now!
More learning
CFI is the official global provider of the Financial Modeling and Valuation Analyst designationBecome a Certified Financial Modeling & Valuation Analyst (FMVA)®CFI's Financial Modeling and Valuation Analyst (FMVA)® certification will help you gain the confidence you need in your finance career. Enroll today! and is on a mission to help you Advance Your Career. To learn more about other types of financial analysis you may want to check out these additional CFI resources:
- Profit MarginNet Profit MarginNet Profit Margin (also known as "Profit Margin" or "Net Profit Margin Ratio") is a financial ratio used to calculate the percentage of profit a company produces from its total revenue. It measures the amount of net profit a company obtains per dollar of revenue gained.
- Return on Ad SpendROAS (Return on Ad Spend)ROAS (Return on Ad Spend) is an important eCommerce metric. ROAS measures revenue generated per dollar of marketing spent. It is a similar and alternative profitability metric to ROI, or "Return on Investment". ROAS is commonly used in eCommerce businesses to evaluate the effectiveness of a marketing campaign.
- Leverage RatiosLeverage RatiosA leverage ratio indicates the level of debt incurred by a business entity against several other accounts in its balance sheet, income statement, or cash flow statement. Excel template
- What is Financial ModelingWhat is Financial ModelingFinancial modeling is performed in Excel to forecast a company's financial performance. Overview of what is financial modeling, how & why to build a model.
- Financial Modeling for DummiesFinancial Modeling for BeginnersFinancial modeling for beginners is our introductory guide to financial modeling - we cover how to build a model, Excel formulas, best practices, and more.
- How to be a great financial analystThe Analyst Trifecta® GuideThe ultimate guide on how to be a world-class financial analyst. Do you want to be a world-class financial analyst? Are you looking to follow industry-leading best practices and stand out from the crowd? Our process, called The Analyst Trifecta® consists of analytics, presentation & soft skills
To find out more about finance careers, try out our interactive Career Map.
-
Understanding Contribution Margin After Marketing (CMAM): Definition & Calculation
Contribution margin after marketing (CMAM) refers to the amount of money generated for each unit sold after deducting the variable costsVariable CostsVariable costs are expenses that vary in proportio
-

Understanding the Price-to-Earnings (P/E) Ratio: A Beginner's Guide
Trying your hand at the stock market? Chances are, you’ve come across the term “P/E ratio”. If you’re like many who are new to the stock market, you’ve looked at this phrase and asked you
finance
- Understanding the CAPE Ratio: A Guide to Cyclically Adjusted P/E
- Common Size Ratios: Understanding and Application
- Gross Margin Ratio: Definition & Calculation | [Your Brand/Website]
- Ratio Analysis: A Comprehensive Guide to Financial Statement Insights
- Pretax Margin Ratio: Definition & Analysis | Financial Insights
- Understanding Contribution Margin: A Key Profit Metric
- Contribution Margin: Definition, Calculation & Importance
- Quick Ratio: Understanding Liquidity & Financial Health
- Gross Margin Explained: Definition, Calculation & Importance
-
 Accounts Payable Turnover Ratio: Meaning, Calculation & Implications
A high accounts payable ratio signals that a company is paying its creditors and suppliers quickly, while a low ratio suggests the business is slower in paying its bills. This is a critical metric to ...
-
 Accounts Receivable Turnover Ratio: Meaning, Calculation & Importance
The accounts receivable turnover ratio is one metric to watch closely as it measures how effectively a company is handling collections. If money is not coming in from customers as agreed and expected,...