Common Size Ratios: Understanding and Application
The Common Size Ratio refers to any number on a business’ financial statementsThree Financial StatementsThe three financial statements are the income statement, the balance sheet, and the statement of cash flows. These three core statements are that is expressed as a percentage of a base.
Global Common Size Ratios
Global common size ratios express a number on a business’ financial statement as a percentage of a denominating relevant number on the statement. Thus, all the percentages shown can be easily interpreted and compared to other line items in the financial statement.
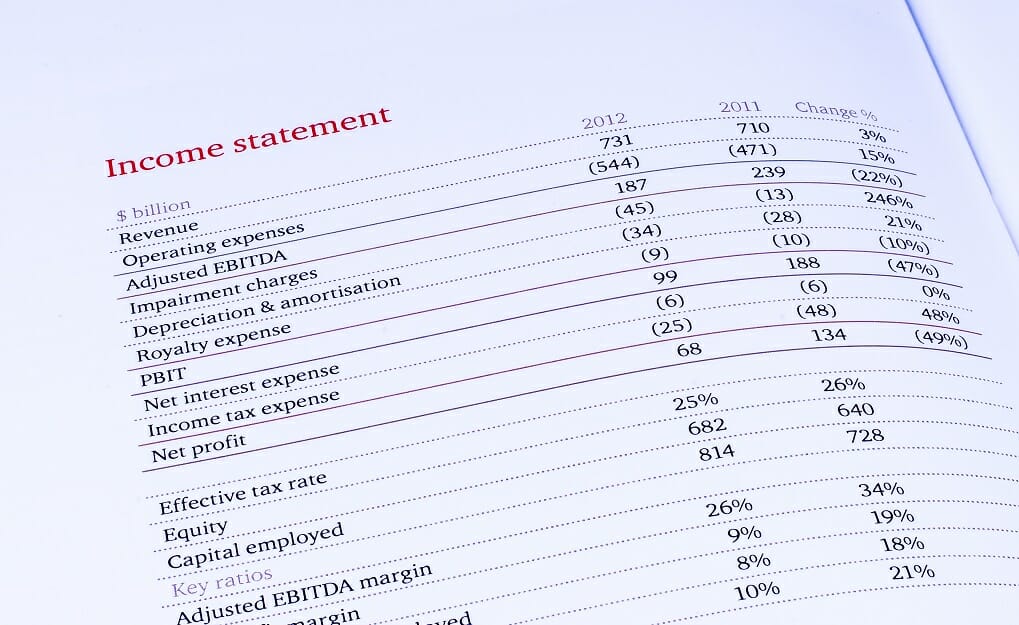
Consider BCD Cookies Ltd, an organization that wants to conduct financial statements analysis. The first step to better understanding the cost breakdown of the enterprise is to convert its statements into the common size format. Take, for instance, the income statementIncome StatementThe Income Statement is one of a company's core financial statements that shows their profit and loss over a period of time. The profit or – which can be converted to express a common size ratio by dividing all line items by the top line revenue. Below is a snippet of what this would look like:

The same methodology can also be applied to the business’ other financial statements in order to get a different perspective. For the balance sheetBalance SheetThe balance sheet is one of the three fundamental financial statements. The financial statements are key to both financial modeling and accounting., you can focus on the asset section and divide all line items by the business’ total assets to better understand the company. By doing so, you can examine individual asset accounts and get a better understanding of their respective weights on the balance sheet.
With the cash flow statementCash Flow StatementA cash flow Statement contains information on how much cash a company generated and used during a given period., you can divide the statement into its three parts (financing activities, investing activities, and operating activities). Then compute the relevant common size ratio by dividing the line items by the net cash flow for the specific section of the statement. Conversely, you can take a broader view of the business’ cash situation by dividing all line items by the net cash flow amount.
Tailored Common Size Ratios
Consider again as an example BCD Cookies, which recently reported a revenue of $5 million. Jack, the business owner, wants to express the figure as a function of a base. First, he must find a base that is relevant to the analysis that he wants to conduct.
Supposing that Jack wants to gather additional insights about the way that his business costs are laid out, he may use the cost of goods sold (COGS)Cost of Goods Sold (COGS)Cost of Goods Sold (COGS) measures the “direct cost” incurred in the production of any goods or services. It includes material cost, direct as a base. Supposing that the business posted a COGS of $2 million, the common size revenue per COGS would be (5 / 2) x 100 = 250%. The number could also be expressed as a multiple such as 2.5x. Thus, Jack is able to conclude that his revenue is 2.5x the business’ COGS.
While the common size approach may be useful in conducting financial statement analysis, it may sometimes be quite difficult to derive meaning from the ratios.
Using Common Size Ratios
Common size ratios can be very useful when trying to get a better understanding of a business. However, they need to be examined within a certain context in order to derive meaningful conclusions.
Common size ratios are most effective when compared across multiple companies that operate in the same industry. This enables you to rank companies based on specific metrics. Ratio analysis can help with the identification of a business’ strengths and weaknesses. That can, in turn, help in formulating changes to the business’ overall strategy.
Common size ratios are also very useful when compared over a certain time period. This enables you to more easily observe trends in specific metrics and, in turn, adjust the business’ strategy in order to arrive at a more optimal outcome.
When comparing any two common size ratios, it is important to make sure that they are computed by using the same base figure. Failure to do so will render the comparison meaningless.
Additional Resources
CFI offers the Financial Modeling & Valuation Analyst (FMVA)™Become a Certified Financial Modeling & Valuation Analyst (FMVA)®CFI's Financial Modeling and Valuation Analyst (FMVA)® certification will help you gain the confidence you need in your finance career. Enroll today! certification program for those looking to take their careers to the next level. To keep learning and advancing your career, the following CFI resources will be helpful:
- Corporate StrategyCorporate StrategyCorporate Strategy focuses on how to manage resources, risk and return across a firm, as opposed to looking at competitive advantages in business strategy
- Projecting Balance Sheet Line ItemsProjecting Balance Sheet Line ItemsProjecting balance sheet line items involves analyzing working capital, PP&E, debt share capital and net income. This guide breaks down how to calculate
- Projecting Income Statement Line ItemsProjecting Income Statement Line ItemsWe discuss the different methods of projecting income statement line items. Projecting income statement line items begins with sales revenue, then cost
- Financial RatiosFinancial RatiosFinancial ratios are created with the use of numerical values taken from financial statements to gain meaningful information about a company
-

Information Ratio: A Comprehensive Guide to Risk-Adjusted Returns
The information ratio measures the risk-adjusted returns of a financial asset or portfolio relative to a certain benchmarkDow Jones Industrial Average (DJIA)The Dow Jones Industrial Average (DJIA), al
-

Inventory Turnover Ratio: Definition & Calculation
The inventory turnover ratio, also known as the stock turnover ratio, is an efficiency ratio that measures how efficiently inventoryInventoryInventory is a current asset account found on the bala
finance
- Understanding the CAPE Ratio: A Guide to Cyclically Adjusted P/E
- Common Size Analysis: A Comprehensive Guide for Financial Statement Analysis
- Current Ratio: Definition, Calculation & Financial Health
- Ratio Analysis: A Comprehensive Guide to Financial Statement Insights
- Operating Ratio: Definition, Calculation & Importance
- Quick Ratio: Understanding Your Business's Short-Term Liquidity
- Reserve Ratio Explained: Understanding Bank Reserves
- Understanding the Retention Ratio: Reinvesting for Growth
- Sharpe Ratio: Calculate & Interpret Investment Performance
-
 Goodwill to Assets Ratio: Definition & Analysis
The goodwill to assets ratio measures the amount of goodwill a company has recorded on its books compared to its total assetsTypes of AssetsCommon types of assets include current, non-current, ph...
-
 Gross Margin Ratio: Definition & Calculation | [Your Brand/Website]
The Gross Margin Ratio, also known as the gross profit margin ratio, is a profitability ratioProfitability RatiosProfitability ratios are financial metrics used by analysts and investors to measure an...