Understanding Leverage Effect Measures: Quantifying Business Risk
Leverage effect measures aim to quantify how much business risk a given company is currently experiencing. Business risk refers to the revenue variance that a business can expect to see, and how sensitive net incomeNet IncomeNet Income is a key line item, not only in the income statement, but in all three core financial statements. While it is arrived at through is to changes in revenues. Leverage effect measures aim to show how the business’ fixed and variable costsFixed and Variable CostsCost is something that can be classified in several ways depending on its nature. One of the most popular methods is classification according can impact profitability when revenues change. In this article, we will be looking at the Operational Leverage Effect (OLE), Financial Leverage Effect (FLE), and Total Leverage Effect (TLE) ratios.

Operational Leverage Effect Measure
The operational leverage effect is used to generate an estimate of how changes in ROAReturn on Assets & ROA FormulaROA Formula. Return on Assets (ROA) is a type of return on investment (ROI) metric that measures the profitability of a business in relation to its total assets. (return on assets) and net income are related to changes in sales volume. The measure is particularly useful for businesses that operate with fairly high fixed costs and that tend to see quite a bit of variance in their revenues.
To calculate the Operational Leverage Effect Measure (OLE), we can use the following formula:
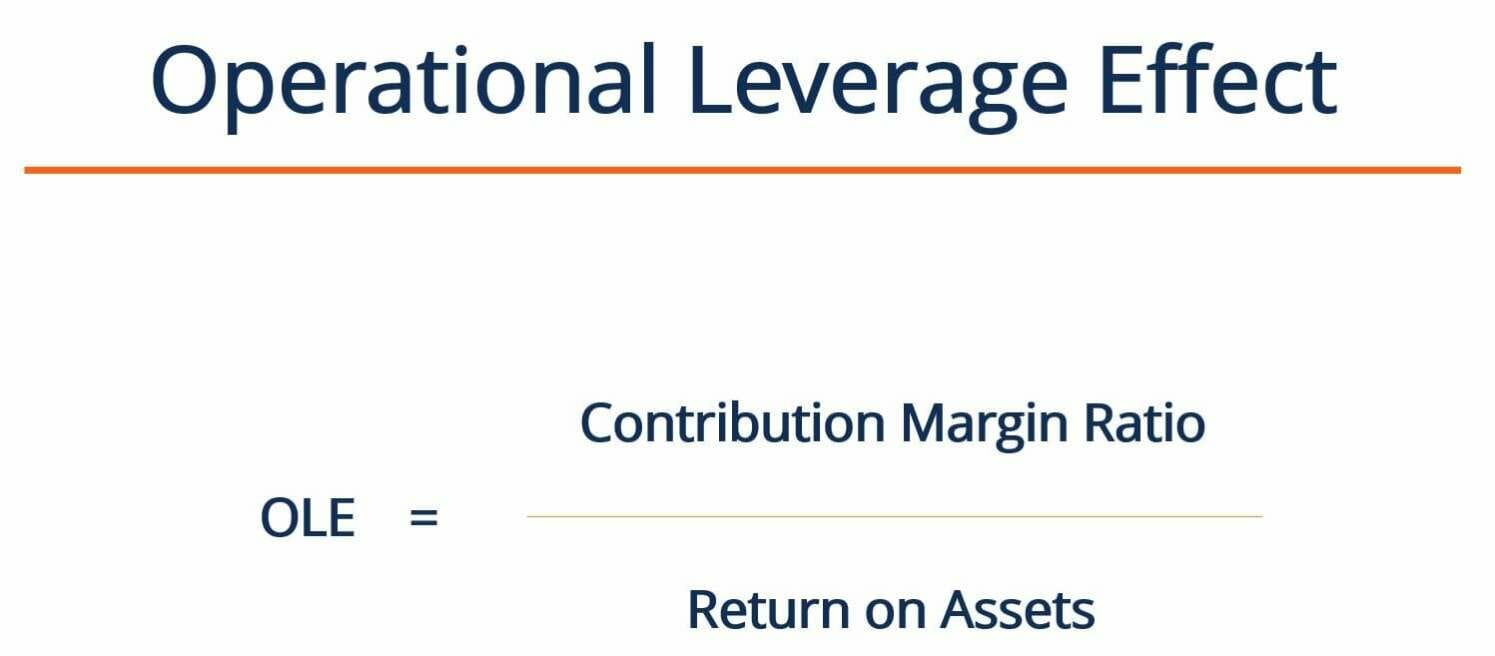
If a company reports an Operational Leverage Effect that is greater than 1, the company is said to be operationally leveraged (i.e., with fixed costs). The significance of the operational leverage depends on how the company’s OLE compares to the OLE of competing firms. Looking at how the company’s OLE changes over time also enables us to gain insight about the business.
If the OLE is equal to 1, then all costs incurred by the company are variable. Thus, an increase or decrease in sales would lead to a proportional increase or decrease in ROA.
Financial Leverage Effect Measure
Organizations that utilize debt in their capital structure Capital StructureCapital structure refers to the amount of debt and/or equity employed by a firm to fund its operations and finance its assets. A firm's capital structureface more business risk than purely equity-financed organizations. Since such companies are obligated to make regular interest payments to lenders, they are also more operationally leveraged. This is because there will always be a cash drain – interest payments – that may hinder the company’s profitability. Investors consider companies that utilize a lot of debt financing as riskier. This is because the more debt a company takes on, the higher the probability of the company defaulting on its loans.
To measure the financial leverage effect, we can use the following equation:
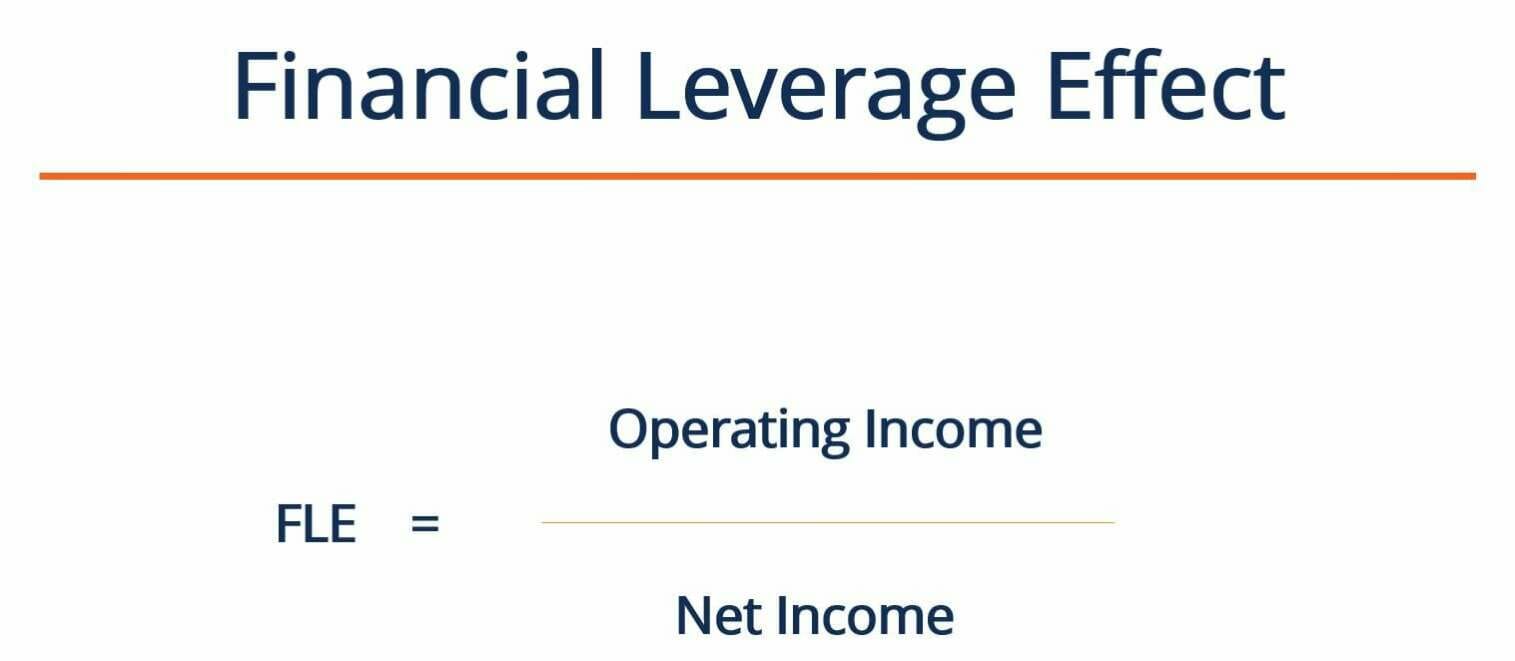
The FLE measure can be used to quantify the sensitivity of net income to operating income. The main items separating these figures are the company’s interest payments, taxes, and depreciation and amortization. Those costs are highly dependent upon the company’s capital structure. FLE aims to measure the degree of financial leverage that a business faces, based on its capital structure.
Suppose a given business’ FLE is 1.5. That means that if its operating income increased by 10%, then its net income would increase by 15%. You find the effect on net income by multiplying the change in operating income by the FLE number.
Total Leverage Effect Measure
The Total Leverage Effect (TLE) is a combination of both the FLE and OLE. It can be calculated using the following equation:
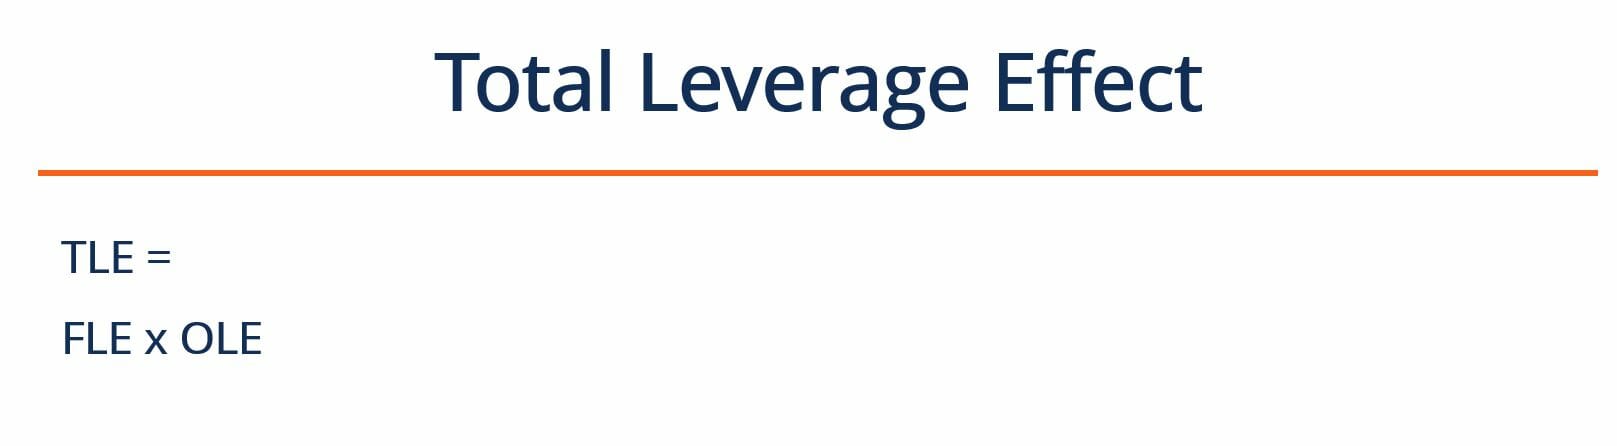
The TLE measure aggregates both the FLE and OLE measures into a single number that aims to encompass the business’ overall state of leverage. The TLE takes into account all of the financial and operational leverage that a business faces, and quantifies the company’s overall business risk due to leverage.
TLEs can be calculated for several companies in the same industry to see which businesses are most leveraged. The historical TLEs for a company can also be looked at to see whether the business is trending, over time, toward being more, or less, leveraged.
Additional Resources
Thank you for reading CFI’s explanation of Leverage Effect Measures. CFI offers the Financial Modeling & Valuation Analyst (FMVA)™Become a Certified Financial Modeling & Valuation Analyst (FMVA)®CFI's Financial Modeling and Valuation Analyst (FMVA)® certification will help you gain the confidence you need in your finance career. Enroll today! certification program for those looking to take their careers to the next level. To learn more about related topics, check out the following CFI resources:
- NPV FunctionNPV FunctionThe NPV Function is categorized under Excel Financial functions. It will calculate the Net Present Value (NPV) for periodic cash flows. The NPV will be calculated for an investment by using a discount rate and series of future cash flows. In financial modeling, the NPV function is useful in determining the value of a business
- Internal Rate of Return (IRR)Internal Rate of Return (IRR)The Internal Rate of Return (IRR) is the discount rate that makes the net present value (NPV) of a project zero. In other words, it is the expected compound annual rate of return that will be earned on a project or investment.
- Payback PeriodPayback PeriodThe payback period shows how long it takes for a business to recoup an investment.
- DCF Model TemplateDCF Model TemplateThis DCF model template provides you with a foundation to build your own discounted cash flow model with different assumptions
-

Monetary Assets: Definition, Examples & Key Characteristics
Monetary assets are assets that carry a fixed value in terms of currency units (e.g., dollars, euros, yen). They are stated as a fixed value in dollar terms even when macroeconomic factors, such as in
-

Understanding Non-Monetary Assets: Definition & Examples
Non-monetary assets are assets whose value frequently changes in response to changes in economic and market conditions. The assets appear on the balance sheet under intangible and non-current assetsNo
finance
- Understanding Agency Costs: Protecting Shareholder Interests
- CCPPO Shares Explained: Understanding Cumulative, Convertible, & Participating Preferred Stock
- Understanding Company Bylaws: A Comprehensive Guide
- Corporate Bonds: A Comprehensive Guide to Investing
- Understanding Earnings: A Guide to Financial Profitability
- Leverage in Finance: Strategies, Types & Risks
- Understanding Leverage Effect Measures: Quantifying Business Risk
- Leverage Ratios: Understanding Financial Risk & Debt
- Economic Austerity Measures: Definition, Impact & Effectiveness
-
 Industrial REITs: Investing in the Future of Logistics & Warehousing
Industrial REITs are companies that own and manage real estate properties that are used for manufacturing, production, storage, and distribution of goods. The structure under which industrial REITs op...
-
 Understanding Dividends: A Guide for Investors
There are advantages and disadvantages relative to investing in stocks with dividends vs stocks without dividends. Dividends are periodic payments made by companies to owners of its stock. They are a ...