Time Series Data Analysis: A Comprehensive Overview
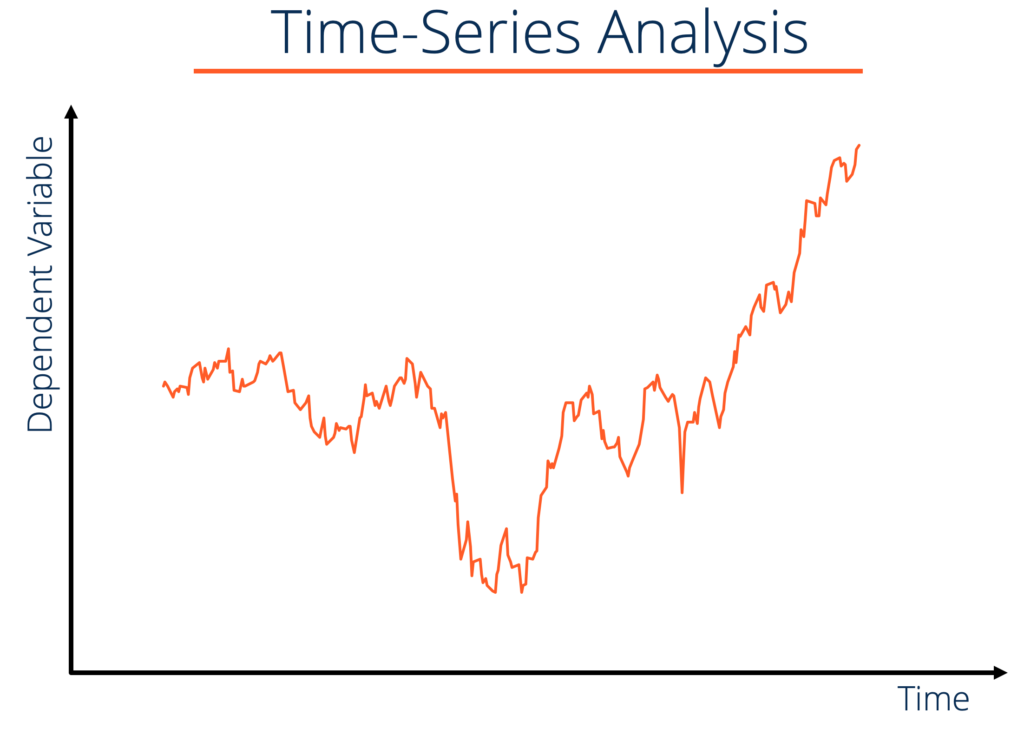
Time series data analysis is the analysis of datasets that change over a period of time. Time series datasets record observations of the same variableIndependent VariableAn independent variable is an input, assumption, or driver that is changed in order to assess its impact on a dependent variable (the outcome). over various points of time. Financial analystsFinancial Analyst Role use time series data such as stock price movements, or a company’s salesSales RevenueSales revenue is the income received by a company from its sales of goods or the provision of services. In accounting, the terms "sales" and over time, to analyze a company’s performance.
Examples of time series datasets include:
- The Gross Domestic Product (GDP)Gross Domestic Product (GDP)Gross domestic product (GDP) is a standard measure of a country’s economic health and an indicator of its standard of living. Also, GDP can be used to compare the productivity levels between different countries. of the United States of America between 2010 and 2015 – The economic unit of analysis is the U.S. The economic unit of analysis is for the time period 2010-2015. A typical entry from this dataset would be (2012, $16.16 trillion).
- The GDP per capita of Germany between 2008 and 2018 – The economic unit of analysis is Germany. The economic unit of analysis is for the time period 2008-2018. A typical entry from this dataset would be (2010, $41,700).
- Total steel exported by India between 2000 and 2018 – The economic unit of analysis is India. The economic unit of analysis is for the time period 2000-2018. A typical entry from this dataset would be (2015, $3.17 billion).
- Total oranges eaten by a specific household in Ghana between 2008 and 2018 – The economic unit of analysis is a specific household in Ghana (e.g., Household 302). The economic unit of analysis is for the time period 2008-2018. A typical entry from this dataset would be (2018, 200).
Correlation
Unlike cross-sectional data analysis, time series data analysis cannot make use of the random sampling framework. This makes time series data analysis much more complex and computationally demanding than cross-sectional data analysis. Random sampling cannot be used because the past values of a variable are almost always highly correlated with the present value of that variable.
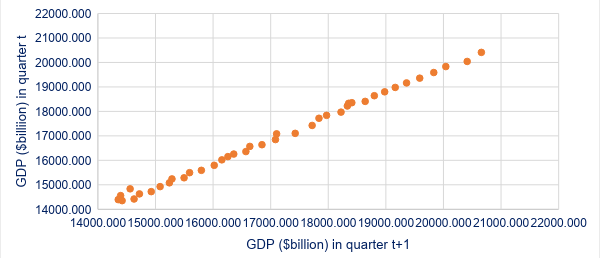
For example, the GDP of the US in the fourth quarter of 2017 is highly correlated with the GDP in the third quarter of 2017. The degree of correlationCorrelationA correlation is a statistical measure of the relationship between two variables. The measure is best used in variables that demonstrate a linear relationship between each other. The fit of the data can be visually represented in a scatterplot. is much higher than the correlation across economic entities at the same point in time.
The correlation coefficient between the US GDP in the current quarter and the US GDP in the previous quarter for the period 2008 to 2018 is 0.998. The correlation coefficient between the US GDP in the current year and the US GDP in the previous year for the period 2008 to 2018 is 0.992.
Causal Questions and Time Series Analysis
The majority of economic analysis involves the study of intertemporal causal claims. Examples include:
- How much does a 1% increase in current period GDP affect future period GDP?
- How does the past unemployment rate affect the current unemployment rateEconomic IndicatorsAn economic indicator is a metric used to assess, measure, and evaluate the overall state of health of the macroeconomy. Economic indicators?
- What is the effect of a 1% increase in Grade 7 test scores on Grade 8 test scores?
Consider the test scores example: Suppose there is some policy instrument (e.g., increasing the teacher-student ratio) that can be used to increase Grade 7 test scores by 1%. Such a policy change is likely to be very expensive, and a policymaker who only looks at Grade 7 test scores might not implement the policy.
However, suppose a 1% increase in Grade 7 test scores is associated with a 0.5% increase in Grade 8 test scores. This additional benefit may make implementing the policy worthwhile.
More Resources
Thank you for reading CFI’s guide to Time Series Data Analysis. To keep advancing your career, the additional CFI resources below will be useful:
- Clustering IllusionClustering IllusionClustering illusion refers to a cognitive bias in behavioral finance in which an investor observes patterns in what are actually random events. In other
- Point EstimatorsPoint EstimatorsA point estimator is a function that is used to find an approximate value of a population parameter from random samples of the population. It uses the
- Stock Investing: A Guide to Growth InvestingStock Investing: A Guide to Growth InvestingInvestors can take advantage of new growth investing strategies in order to more precisely hone in on stocks or other investments offering above-average growth potential.
- Time Period BiasTime Period BiasTime period bias is a sampling error caused by selecting observations that only cover a certain time period (i.e., a certain set of circumstances or factors
-
Top-Down Analysis: A Comprehensive Guide for Investors
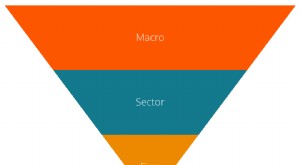
Top-down analysis starts by analyzing macroeconomic indicators, then performing a more specific sector analysis. Only after that does it dive into the fundamental analysis of a specific firm. It is th
-

Trend Investing: A Guide to Capitalizing on Market Growth
Trend investing in today’s market A strategy employed by some investors in which they place their money in industries, stocks, or markets that are expected to boom in the f
finance
- Compound Interest Explained: How It Works & Benefits
- Contribution Analysis: Understanding Profitability & Cost Management
- Credit Analysis: A Comprehensive Guide to Assessing Credit Risk
- DuPont Analysis: A Comprehensive Guide to Profitability Assessment
- Horizontal Analysis: Understanding Financial Trends & Growth
- Quantitative Analysis: Definition, Methods & Applications
- Financial Analysis: A Comprehensive Guide for Professionals
- Technical Analysis: A Comprehensive Guide to Predicting Stock Prices
- Fundamental Analysis: A Guide to Crypto Value
-
 Industry Analysis: A Comprehensive Guide for Business Insights
Industry analysis is a market assessment tool used by businesses and analysts to understand the competitive dynamics of an industry. It helps them get a sense of what is happening in an industry, e.g....
-
![Pareto Analysis: The 80/20 Rule Explained | [Your Brand/Website Name]](https://www.etffin.com/article/uploadfiles/202110/2021100815414246_S.jpeg) Pareto Analysis: The 80/20 Rule Explained | [Your Brand/Website Name]
Pareto Analysis: The 80/20 Rule Explained | [Your Brand/Website Name]Pareto analysis is a decision-making tool used to compare and fix problems strategically. It uses the Pareto principle, which is also known as the 80/20 rule – named after Italian economist Vilf...