YoY Analysis: Understanding Year-over-Year Growth & Financial Insights
YoY stands for Year over Year and is a type of financial analysisAnalysis of Financial StatementsHow to perform Analysis of Financial Statements. This guide will teach you to perform financial statement analysis of the income statement, that’s useful when comparing time series data. Analysts are able to deduce changes in the quantity or quality of certain business aspects with YoY analysis. In finance, investors usually compare the performance of financial instruments on a year-over-year basis to gauge whether or not an instrument is performing expected. This analysis is also very useful when analyzing growth patterns and trends.
Economic analysts also commonly use this approach when analyzing countries and their overall economic situation. For example, the YoY approach finds that Japanese GDP grew 2% in 2016 as compared to 2015, while analysts previously only projected an increase of 1.8%
YoY and seasonality
The YoY approach may also be useful in analyzing monthly revenue growth, especially when the sources of revenue are cyclical. This allows an apples-to-apples comparison of revenue instead of comparing revenue month-over-month where there may be large seasonal changes.
For example, in the relatively seasonal chocolate industry, it would be more useful to compare revenue growth between December 2016 and December 2017 (where sales are high due to winter sales), as opposed to comparing March 2016 to February 2016, where holiday sales have started to slow. By comparing months in a year-over-year fashion, the comparison becomes more relevant than two consecutive months that are affected by varying seasonality or other factors.
Common YoY financial metrics
Here is a list of the most commonly used financial metrics for conducting a year-over-year comparison:
- Sales revenueSales RevenueSales revenue is the income received by a company from its sales of goods or the provision of services. In accounting, the terms "sales" and – how much have sales increased or decreased year over year
- Cost of Goods Sold (COGS) – how well has the company been able to manage its gross margin
- Selling General & AdministrativeSG&ASG&A includes all non-production expenses incurred by a company in any given period. It includes expenses such as rent, advertising, marketing expense (SG&A) – how well have executives managed their corporate office expenses
- Earnings Before Interest Taxes Depreciation and AmortizationEBITDAEBITDA or Earnings Before Interest, Tax, Depreciation, Amortization is a company's profits before any of these net deductions are made. EBITDA focuses on the operating decisions of a business because it looks at the business’ profitability from core operations before the impact of capital structure. Formula, examples (EBITDA) – a measure of operating profit and a proxy for cash flow
- Net IncomeNet IncomeNet Income is a key line item, not only in the income statement, but in all three core financial statements. While it is arrived at through – comparing the bottom line of the business over time
- Earnings Per ShareEarnings Per Share Formula (EPS)EPS is a financial ratio, which divides net earnings available to common shareholders by the average outstanding shares over a certain period of time. The EPS formula indicates a company’s ability to produce net profits for common shareholders. (EPS) – looking at the bottom line on a per-share basis
Common YoY economic indicators
Here is a list of the most commonly used metrics for conducting a year-over-year comparison:
- Inflation – what is the trend in inflation
- Unemployment ratesCyclical UnemploymentCyclical unemployment is a type of unemployment where labor forces are reduced as a result of business cycles or fluctuations in the economy, – what is the workforce participation rate trend
- GDPGDP FormulaGross Domestic Product (GDP) is the monetary value, in local currency, of all final economic goods and services produced in a country during a – how much gross domestic product is a country producing
- Interest rates – are we in a rising or falling interest rate environment
Alternatives to YoY analysis
As an alternative to YoY analysis, an analyst may also want to look at other time-series data such as:
- Month-over-Month
- Quarter-over-Quarter
- Year-to-date
- Compound growth rates
Download the Free Template
Enter your name and email in the form below and download the free template now!
Example of YoY analysis
Here is a detailed example of YoY analysis in action. This example comes from a financial modelingWhat is Financial ModelingFinancial modeling is performed in Excel to forecast a company's financial performance. Overview of what is financial modeling, how & why to build a model. exercise where an analyst is comparing the number of units sold in Q3 2018 to the number of units sold in Q3 2017.
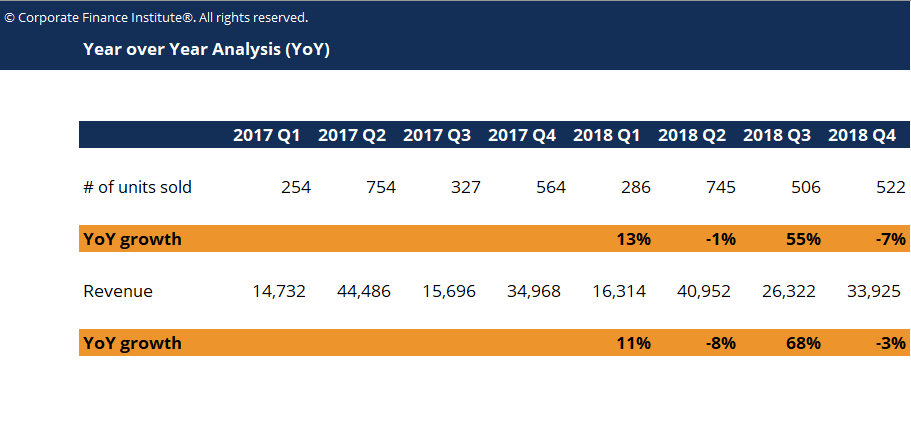
Let’s break down the YoY analysis step by step.
There were 506 units sold in Q3 2018 and 327 units sold in Q3 2017. To compare the two, we take 506 and divide it by 327, then subtract one. The result shows a 55% increase in units sold on a year-over-year basis between Q3-2018 and Q3-2017.
More Resources
CFI offers the Capital Markets & Securities Analyst (CMSA)®Program Page - CMSAEnroll in CFI's CMSA® program and become a certified Capital Markets &Securities Analyst. Advance your career with our certification programs and courses. certification program for those looking to take their careers to the next level. To keep learning and advance your career, the following resources will be helpful:
- Analysis of Financial StatementsAnalysis of Financial StatementsHow to perform Analysis of Financial Statements. This guide will teach you to perform financial statement analysis of the income statement,
- Advanced Excel FormulasAdvanced Excel Formulas Must KnowThese advanced Excel formulas are critical to know and will take your financial analysis skills to the next level. Download our free Excel ebook!
- Interactive Career Map
- How to Be a Great Financial AnalystThe Analyst Trifecta® GuideThe ultimate guide on how to be a world-class financial analyst. Do you want to be a world-class financial analyst? Are you looking to follow industry-leading best practices and stand out from the crowd? Our process, called The Analyst Trifecta® consists of analytics, presentation & soft skills
-

Understanding Financial Hardship: Causes, Impacts & Relief
Different programs make hardship decisions based on different criteria. Financial hardship usually refers to a situation in which a person cannot keep up with debt payments and bills. This pa
-

Understanding Financial Exposure: Investment Risk & Potential Losses
Financial exposure is a term used to describe investment risk. It is a calculation of the amount of money that an investor might potentially lose from an investment. An investor’s financial expo
finance
- Understanding Auditors: Roles, Responsibilities & Audit Processes
- EBITDARM Explained: A Comprehensive Guide to Financial Analysis
- Eurocurrency Explained: What It Is & How It Works
- Factset: Financial Data & Analytics Solutions for Investment Professionals
- Understanding Finance: A Comprehensive Overview of Key Concepts
- Understanding Financial Crises: Causes, Impacts, and Examples
- Financial Engineering: Principles, Applications & Career Paths
- Understanding Your Financial Health: A Comprehensive Guide
- Financial Inclusion: Definition, Benefits & Impact
-
 Financial Analysis: A Comprehensive Guide for Professionals
Financial analysis involves using financial dataFinancial DataWhere to find data for financial analysts - Bloomberg, CapitalIQ, PitchBook, EDGAR, SEDAR and more sources of financial data for financial...
-
 Defining Financial Success: Goals & Strategies for a Secure Future
Monetary success is difficult to define in concrete terms. Even though everyone has their own definitions, there is plenty of advice on how to plan for a better financial futu...