Understanding Dead Cat bounces: A Stock Market Indicator
The dead cat bounce describes a financial phenomenon whereby a stock in a steady decline suddenly, and without a logical cause, gains value temporarily before continuing its downward trend. The term originates from the saying that even a dead cat will bounce if dropped from high enough.

Summary
- The dead cat bounce is a sudden and temporary increase in stock price caused by investors erroneously believing that the stock price’s reached its lowest.
- The dead cat bounce can only be fully accurately determined with concrete data in hindsight.
- Both falsely identifying a stock price trough (i.e., falling victim to a dead cat bounce) and falsely identifying a true price trough as a dead cat bounce will result in negative financial consequences.
True Price Trough vs. Dead Cat Bounce
True Price Trough
Successful investors are able to discern incipient companies and buy their stocks before other investors become aware of the company’s profitability.
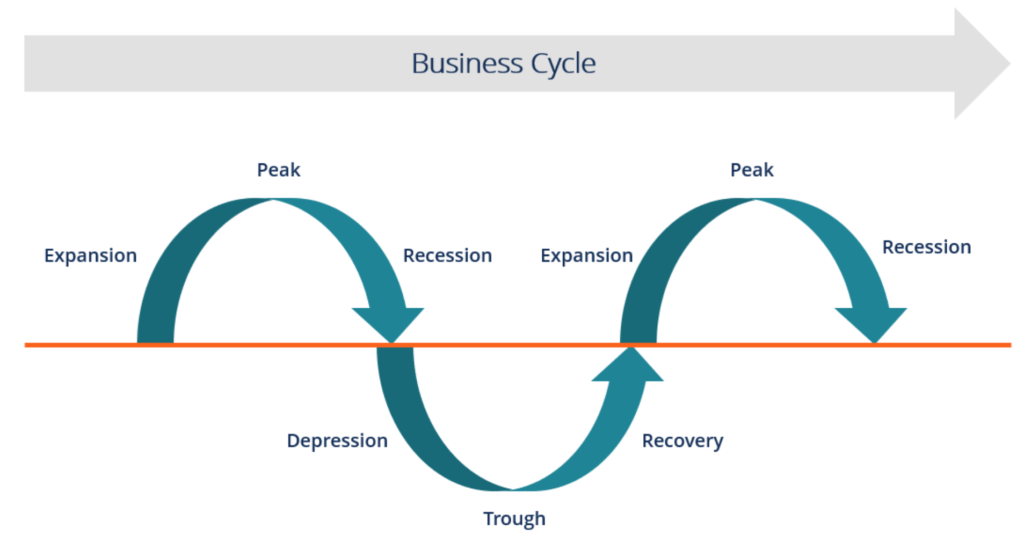
As stock prices reflect the profitability of businesses in the eyes of investors, the basis of the stock price should reflect a business cycleBusiness CycleA business cycle is a cycle of fluctuations in the Gross Domestic Product (GDP) around its long-term natural growth rate. It explains the. Thus, a hallmark of a great investor is the ability to correctly identify the trough of a business cycle early and pinpoint a stock when its share price’s reached its lowest.
When the public becomes aware that certain stocks are already at their lowest price levels, many investors will start to buy, and the price of the stocks will increase to adjust to the new demand. Then, the prescient investors who bought earlier can opt to either hold or sell the stocks for a gain. Colloquially, it is known as “buying low and selling high.”
Dead Cat Bounce
Unfortunately, while businesses are going through the business cycle, there can be fluctuations in their stock prices. Sometimes, investors erroneously identify a fluctuation as the price trough and purchase stocks when the prices of the stocks are still decreasing.
When many investors commit the error, an intrinsic demand is created and can cause a temporary spike in the stock price.
It’s important to reiterate that the increase in stock value is not due to bright company prospects. Instead, the increase is due to mistakenly assuming that the stock price’s reached its lowest and will start to increase.
An Example During the 2008 Financial Crisis
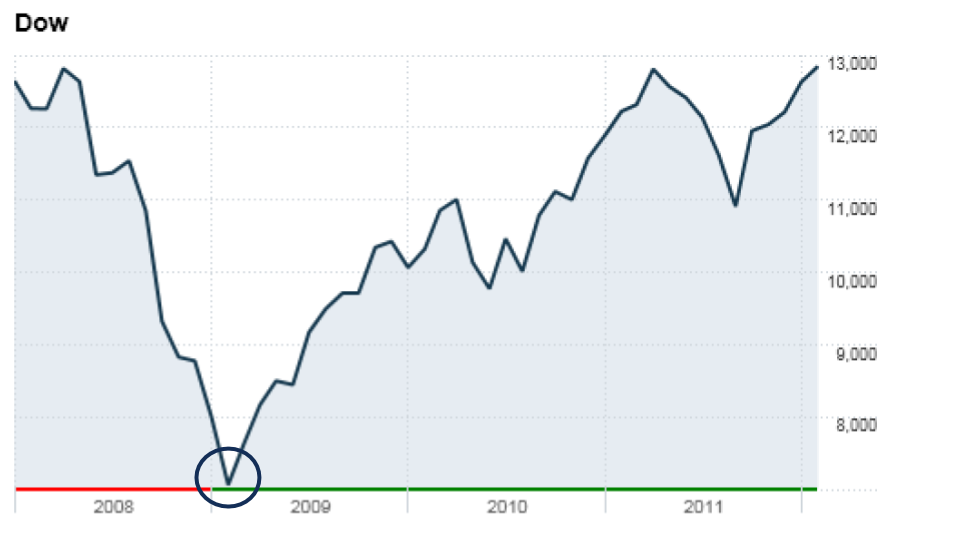
The True Low of the Dow Jones Index
During the 2008 Global Financial Crisis2008-2009 Global Financial CrisisThe Global Financial Crisis of 2008-2009 refers to the massive financial crisis the world faced from 2008 to 2009. The financial crisis took its toll on individuals and institutions around the globe, with millions of American being deeply impacted. Financial institutions started to sink, many were absorbed by larger entities, and the US Government was forced to offer bailouts, the Dow Jones Industrial Average (DJIA) dropped to a low at the beginning of 2009 (indicated by the blue circle). It was an optimal time to buy assets included in the Dow Jones as the market index continued to rise from that point on, providing investors an opportunity to sell high in the future.
The Dead Cat Bounce for the Dow Jones Index in 2008
There was another increase (indicated by the orange circle) in the DJIADow Jones Industrial Average (DJIA)The Dow Jones Industrial Average (DJIA), also referred to as "Dow Jones” or "the Dow", is one of the most widely-recognized stock market indices. mid-2008 that was not reflective of the index price recovering. Instead, it was a falsely identified price trough.
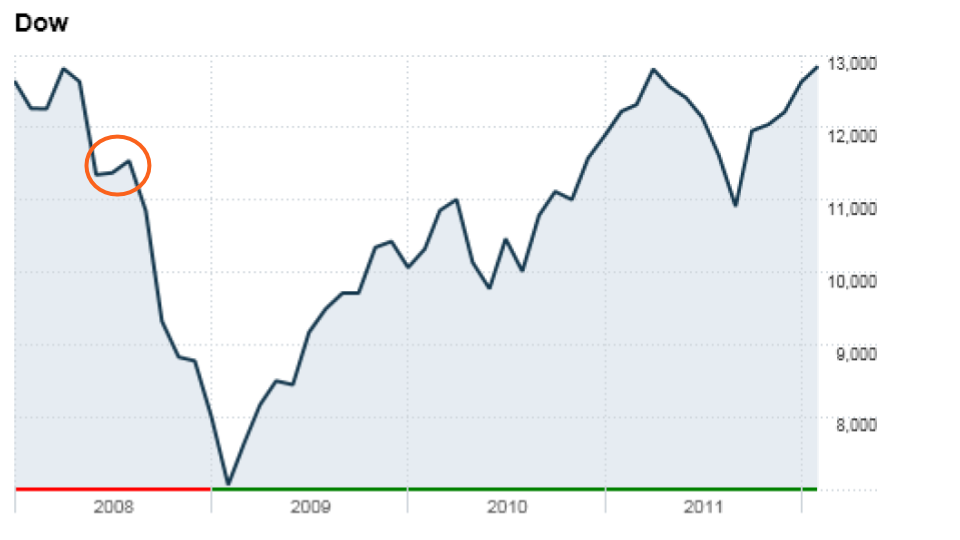
Investors who believed that the economy was recovering purchased shares and fabricated demand for the assets in the Dow Jones Index. The fabricated demand can be seen from the graph above as the temporary spike in the price. However, as it was a dead cat bounce, the price continued to plummet shortly after the sudden rise.
As you can see, the investors who decided to buy stocks of the assets included in the DJIA during the dead cat bounce in 2008 likely did not benefit.
Caveats of the Dead Cat Bounce
1. Difficult to indicate
The most prominent issue with the dead cat bounce is that it cannot be identified with certainty until it is analyzed in hindsight.
Although many financial analystsFinancial Analysts - What Do They Do try to use statistical tools to forecast such an occurrence and to prevent negative consequences for investors, it’s not possible to be definitive until sufficient time passes, and there are enough data for rigorous financial and economic analysis to concretely label a dead cat bounce.
2. Length of dead cat bounces
Dead cat bounces can vary greatly in length of time. An occurrence of a dead cat bounce (i.e., a sudden and false increase in stock prices) can go anywhere from a few days to several months.
The unpredictability of a dead cat bounce furthers the difficulty of correctly identifying a dead cat bounce.
Erroneous Identification of the Dead Cat Bounce
In the first section, we demonstrated that investors buying stocks on the assumption that a stock price’s reached its lowest could lead to a dead cat bounce.
On the other hand, erroneously identifying a dead cat bounce (when it is actually a stock price trough) leads to missed buying opportunities, and thus also carries negative consequences for investors.

An example would be falsely identifying the Dow Jones Index trough (circled in the blue circle above) as a dead cat bounce and missing the opportunity to buy the assets before the stock prices started to increase.
Related Readings
CFI is the official provider of the global Commercial Banking & Credit Analyst (CBCA)™Program Page - CBCAGet CFI's CBCA™ certification and become a Commercial Banking & Credit Analyst. Enroll and advance your career with our certification programs and courses. certification program, designed to help anyone become a world-class financial analyst. To keep advancing your career, the additional CFI resources below will be useful:
- Bullish and BearishBullish and BearishProfessionals in corporate finance regularly refer to markets as being bullish and bearish based on positive or negative price movements. A bear market is typically considered to exist when there has been a price decline of 20% or more from the peak, and a bull market is considered to be a 20% recovery from a market bottom.
- Market TimingMarket TimingMarket timing refers to an investing strategy through which a market participant makes buying or selling decisions by predicting the price movements of the
- Near-The-MoneyNear-The-MoneyNear-the-money means that an option contract’s stock price is close to its strike price. It is used to describe an option’s intrinsic value.
- Stock IndexStock IndexA stock index consists of constituent stocks used to provide an indication of an economy, market, or sector. A stock index is commonly used by investors as
-

Understanding Stock Price Appreciation: A Guide for Investors
Research your chosen stocks in the financial press. Investing in the stock market is one way to build long-term wealth, but it is important to understand your goals when you invest in individ
-
Understanding Strike Price: Options Trading Explained
The strike price is the price at which the holder of the option can exercise the option to buy or sell an underlying security, depending on whether they hold a call optionCall OptionA call option, com
invest
- Dead Cat Bounce: Understanding Temporary Market Rallies
- Accumulation/Distribution (A/D) Indicator: A Comprehensive Guide
- Understanding Adjusted Closing Price: A Comprehensive Guide
- Black-Scholes Model: Understanding Stock Option Pricing
- DAX Index: Your Guide to Germany's Top 30 Companies
- Understanding Quoted Prices: A Comprehensive Guide
- Understanding Stock Prices: A Comprehensive Guide
- Understanding Stock Quotes: A Comprehensive Guide
- Understanding Stock Warrants: A Comprehensive Guide
-
 Quote Stuffing: Understanding Market Manipulation Tactics
Quote stuffing is the practice of entering, and then immediately canceling, a massive number of orders to buy or sell stocks. It is a tactic employed by high-frequency traders (HFT) in an attempt to p...
-
 Understanding the Stock Market: A Beginner's Guide
The stock market refers to public markets that exist for issuing, buying, and selling stocks that trade on a stock exchange or over-the-counter. StocksStockWhat is a stock? An individual who owns stoc...