Understanding Offering Price: A Guide for Investors
The offering price is the per share price of publicly issued securities set by an underwriter and at which the shares are available for purchase. Although the term is mostly used in the context of the issuance of shares, it is also applicable in the issuance of other securities, including bondsBondsBonds are fixed-income securities that are issued by corporations and governments to raise capital. The bond issuer borrows capital from the bondholder and makes fixed payments to them at a fixed (or variable) interest rate for a specified period. and structured instruments.
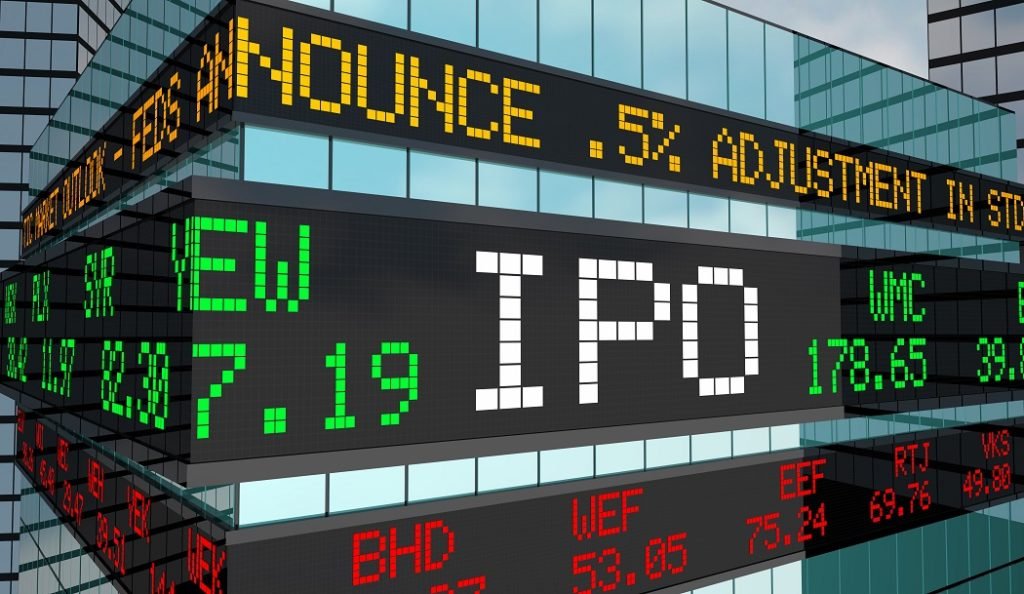
Since the initial public offering (IPO)Initial Public Offering (IPO)An Initial Public Offering (IPO) is the first sale of stocks issued by a company to the public. Prior to an IPO, a company is considered a private company, usually with a small number of investors (founders, friends, family, and business investors such as venture capitalists or angel investors). Learn what an IPO is is a method of capital raising, the offering price is one of the key determinants on how much money a company going through the IPO will be able to raise. Due to this reason, the primary goal of underwriters is to set up an IPO price large enough to raise a substantial amount of money for a company and low enough to attract interest among potential investors.
Offering Price in the IPO
The determination of the offering price is one of the key stages in the IPO. The IPO price is identified and set by the underwriters of participating in the offering. In small IPOs, the offering price can be determined by a bookrunner. A bookrunner is a main underwriting investment bank that leads and directs the offering of a company’s stock. However, in major IPOs, the offering price is set by a syndicate of underwriters that includes several investment banks.
Generally, an underwriter considers numerous factors that can influence the IPO price. For example, an underwriter assesses the current value of a company, as well as its future perspectives. In addition, the IPO price also incorporates the risk overview of the investment and compensates investors for such risk. Finally, the IPO price considers the prevailing supply and demand forces.
At the same time, an underwriter balances the IPO price in a way that is high enough to raise sufficient capital for a company while low enough to stimulate the interest of potential investors to purchase the shares. Maintaining the balance is critical to ensure the execution of a successful IPO.
For example, if an underwriter decides to set a very low offering price, a company will not be able to raise significant capital. Conversely, a high offering price may discourage potential investors from acquiring the issued shares.
Offering Price vs. Opening Price
The offering price and the opening price are two concepts that are extensively mentioned in relation to IPOs but are frequently confused. However, the two terms are distinct from each other.
Essentially, the offering price is the price at which the securities issued in the IPO and can be acquired prior to the start of the actual trading of securities on exchanges. Generally, only institutional and accredited investors are able to purchase newly issued shares at the IPO price.
On the other hand, the opening price is the price at which the newly issued securities start trading on an exchange on the first trading day. Unlike the IPO price, which is set up by the underwriter, the opening price is determined by the supply and demandSupply and DemandThe laws of supply and demand are microeconomic concepts that state that in efficient markets, the quantity supplied of a good and quantity forces prevalent in the market.
More Resources
CFI is the official provider of the global Financial Modeling & Valuation Analyst (FMVA)™Become a Certified Financial Modeling & Valuation Analyst (FMVA)®CFI's Financial Modeling and Valuation Analyst (FMVA)® certification will help you gain the confidence you need in your finance career. Enroll today! certification program, designed to help anyone become a world-class financial analyst. To keep advancing your career, the additional resources below will be useful:
- Capital Raising ProcessCapital Raising ProcessThis article is intended to provide readers with a deeper understanding of how the capital raising process works and happens in the industry today. For more information on capital raising and different types of commitments made by the underwriter, please see our underwriting overview.
- Equity SyndicateEquity SyndicateAn equity syndicate refers to a group of investors who come together to determine the price and sell new IPOs to the public. The syndicate takes various considerations such as risk and the financial status of the company into account when deciding on the price of the floated IPO.
- Greenshoe/OverallotmentGreenshoe / OverallotmentOverallotment, also known as greenshoe option, is an option that is available to underwriters to sell additional shares during an Initial Public Offering (IPO). The underwriters are allowed to sell 15% more shares than the number of shares they originally planned to sell, and the option
- IPO ProcessIPO ProcessThe IPO Process is where a private company issues new and/or existing securities to the public for the first time. The 5 steps discussed in detail
-

Understanding Divergence in Technical Analysis: A Guide
Divergence is when the asset price moves in the direction opposite to what a technical indicator indicates. When a stock is diverging, it signals weaker price trends and the beginning of a reversal.&n
-
Dow 30 Explained: Understanding the Dow Jones Industrial Average
The Dow 30, or Dow Jones Industrial Average, is a stock index that tracks the performance of the 30 biggest companies listed on the stock indices in the United States. Despite being used by analysts t
invest
- Black-Scholes Model: Understanding Stock Option Pricing
- Double Top Pattern: Definition, Trading Signals & Analysis
- Equity Syndicates: A Comprehensive Guide for Investors
- Understanding the Forward Curve: A Comprehensive Guide
- Understanding the Heath-Jarrow-Morton (HJM) Interest Rate Model
- Heston Model: Understanding Volatility in Financial Options
- Understanding Market Support: What is 'Holding the Market'?
- Understanding Quoted Prices: A Comprehensive Guide
- Understanding Strike Price: Options Trading Explained
-
 Understanding Dead Cat bounces: A Stock Market Indicator
The dead cat bounce describes a financial phenomenon whereby a stock in a steady decline suddenly, and without a logical cause, gains value temporarily before continuing its downward trend. The term o...
-
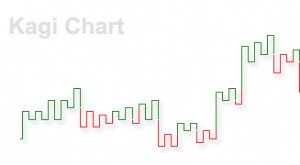 Kagi Chart Explained: A Clearer View of Price Action
The Kagi chart is a type of chart that shows the price movements of an asset. Different from a candlestick chart or other conventional types of charts, a Kagi chart does not contain a time axis, which...