Understanding High Beta Indexes: Risk & Investment Opportunities
A high beta index refers to a market index made up of stocks with higher-than-average volatility compared to the overall stock market. Examples include the S&P 500 High Beta Index, the TSX Composite High Beta Index, the Hang Seng High Beta Index, and the S&P Emerging Markets High Beta Index.
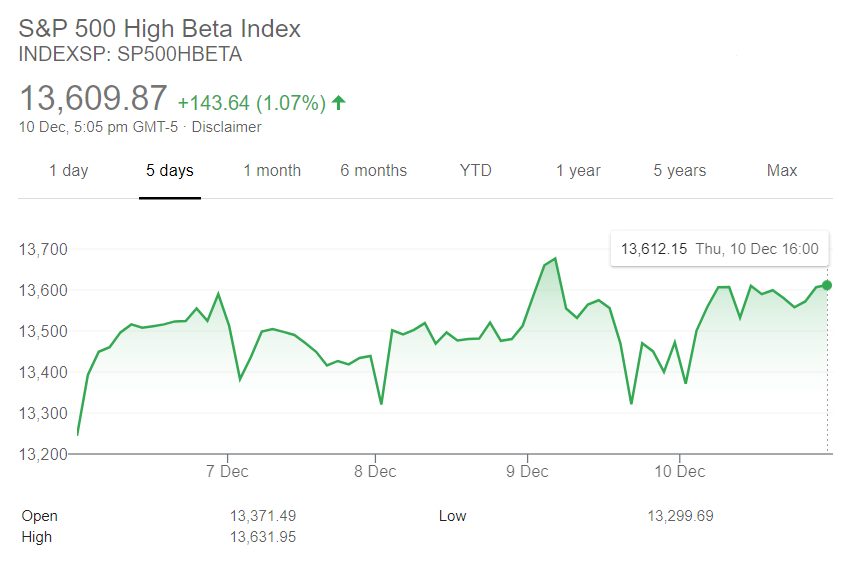
Investors can access the S&P 500 High Beta Index through the Invesco S&P 500 High Beta Index ETF. This exchange-traded fundExchange Traded Fund (ETF)An Exchange Traded Fund (ETF) is a popular investment vehicle where portfolios can be more flexible and diversified across a broad range of all the available asset classes. Learn about various types of ETFs by reading this guide. tracks the 100 stocks in the S&P 500 that have shown the highest beta readings over the previous 12 months. Approximately one-third of the fund’s holdings consist of stocks of publicly-traded companies in the financial services sector.
Summary
- A high beta index refers to a market index that is made up of stocks with higher-than-average volatility as compared to the overall stock market.
- Some investors aim to maximize returns on investment by investing in high beta stocks, especially during periods when the overall stock market is extremely bullish.
- High beta stocks may offer greater potential profits but also include exposure to greater risk.
Understanding Beta
Beta is considered a measurement of systematic riskSystematic RiskSystematic risk is that part of the total risk that is caused by factors beyond the control of a specific company or individual. Systematic risk is caused by factors that are external to the organization. All investments or securities are subject to systematic risk and therefore, it is a non-diversifiable risk., which applies to the broad stock market rather than just to an individual stock. However, beta is actually more of an indicator of volatility. For example, the overall stock market might experience a day when major market indexes gradually rise and close 2% higher on the day.
During the same day, a high beta stock might rise in price 5%, be down 2% on the day, then be up 3%, and eventually close with the same gain as the overall market – 2%. Although the stock ended the day with a gain in price equal to that of the overall market, it did, during the trading day, offer investors the opportunity to sell out their position in the stock for a significantly greater gain of 5%.
A beta reading of 1 means that a stock roughly moves in tandem with the overall stock market. Thus, if a major market index such as the S&P 500S&P 500 IndexThe Standard and Poor’s 500 Index, abbreviated as S&P 500 index, is an index comprising the stocks of 500 publicly traded companies in the is up or down 3%, then the stock is also likely to be up or down approximately 3%. Beta readings between 0 and 1 indicate a stock is likely to experience less up and down movement than the overall stock market.
On the other hand, beta readings greater than 1 (most beta readings of stocks fall between 0 and 3) indicate that a stock is likely to experience greater up and down swings in price than the overall stock market exhibits. A stock with a beta reading of 2 is approximately twice as volatile in its price movements as the overall stock market is.
Although it is rare, a stock may have a negative beta reading. A negative beta value indicates that a stock’s price movements tend to have a negative directional correlation with the overall stock market. In other words, the stock tends to rise when the overall market falls and to fall when the overall market rises.
Why Investors Like High Beta Index Stocks
Investors look to the stocks contained in a high beta index in hopes of attaining better than market average returns on investment. Such investors often focus on high beta stocks when the overall stock market is highly bullish, looking to maximize potential gains from the greater volatility that such stocks are likely to exhibit.
However, with the potential for higher returns also comes higher risk, as both gains and losses can be amplified compared to the overall stock market. During bear marketsBull vs BearThe term bull vs. bear denotes the ensuing trends in stock markets – whether they are appreciating or depreciating in value – and what is the, investors tend to shy away from high beta stocks, as they may suffer greater losses than the overall stock market.
In fact, when adjusted for risk, some studies indicate that low beta stocks outperform high beta stocks over the long term. However, it doesn’t mean that investors might not achieve higher returns on investment by taking maximum advantage of the greater volatility exhibited by high beta stocks.
Keep Learning
CFI is the official provider of the global Capital Markets & Securities Analyst (CMSA)®Program Page - CMSAEnroll in CFI's CMSA® program and become a certified Capital Markets &Securities Analyst. Advance your career with our certification programs and courses. certification program, designed to help anyone become a world-class financial analyst. To keep advancing your career, the additional resources below will be useful:
- AlphaAlphaAlpha is a measure of the performance of an investment relative to a suitable benchmark index such as the S&P 500. An alpha of one (the baseline value is zero) shows that the return on the investment during a specified time frame outperformed the overall market average by 1%.
- Implied Volatility (IV)Implied Volatility (IV)Implied volatility – or simply IV – uses the price of an option to calculate what the market is saying about the future volatility of the
- Market RiskMarket RiskMarket risk, also known as systematic risk, refers to the uncertainty associated with any investment decision. Price volatility often arises due to
- Smart Beta ETFSmart Beta ETFSmart beta ETF, a type of exchange-traded fund, that uses a blend of active and passive investing. The fund follows a rule-based approach for
-

Founders Stock: Definition, Vesting, and Key Differences
Founders stock refers to the equity that is given to the early founders of an organization. This type of stock differs in a few important ways from common stock sold in the secondary marketSecondary M
-

Restricted Stock: Definition, Types & How It Works
Restricted stock refers to an award of stock to a person that is subject to conditions that must be met before the stockholderStockholders EquityStockholders Equity (also known as Shareholders Equity)
invest
- DAX Index: Your Guide to Germany's Top 30 Companies
- Understanding Downtrends: Definition, Identification & Reversal
- High-Low Index: Understanding 52-Week Highs & Lows | [Your Brand]
- Index Investing: A Beginner's Guide to Passive Investing
- Understanding Market Indexes: A Comprehensive Guide
- Understanding Quadruple Witching: A Guide for Investors
- Stock Indexes Explained: A Beginner's Guide to Market Benchmarks
- Understanding Stock Index Futures: A Comprehensive Guide
- Stock Market Indexes: A Comprehensive Guide to Understanding
-
 Understanding Stock Performance: A Guide for Investors
Brokers, investors and day traders are particularly sensitive to the performance of stocks on markets such as the New York Stock Exchange. The performance of stocks vary depending on the industry, pri...
-
All-Ordinaries Index (XAO): Your Guide to Australian Equities
What Is the All-Ordinaries Stock Index? The All-Ordinaries ( or Kangaroos for slang) is a stock index comprised of common shares from the Australian Stock Exchange (ASX). The All-Ordinaries Ind...