Volatility Smile Explained: Understanding Implied Volatility Patterns
A volatility smile refers to a U-shaped graphical representation of the pattern created by the implied volatilities of multiple options contracts that share the same date of expiration. The geographical pattern obtained when the values of different implied volatilitiesImplied Volatility (IV)Implied volatility – or simply IV – uses the price of an option to calculate what the market is saying about the future volatility of the are plotted against the strike prices of their corresponding options; a line is created such that it is upward sloped on either or both ends, similar to a smile.

Summary
- A volatility smile refers to a U-shaped graphical representation of the pattern created by implied volatilities of multiple options contracts that share the same date of expiration.
- The data recorded in a situation where out of the money or in the money options show higher implied volatility than that of at the money options is known as a smile.
- The first volatility smile recorded in financial history was in the aftermath of the Black Monday stock market crash of 1987.
When is a Volatility Smile Observed?
The process of setting the prices for an option is complicated because the valuation of an option is affected by external factors, such as the time left until the maturity of the option, the strike priceStrike PriceThe strike price is the price at which the holder of the option can exercise the option to buy or sell an underlying security, depending on of the option, and the expected level of volatility, or implied volatility of the underlying asset. This irregularity is reflected when a volatility smile is observed in the market.
The most obvious hypothesis that explains why volatility smiles are observed is that there is a higher demand for in the money or out of the money options as opposed to options that are at the money.
Options models that are more refined and developed as compared to the Black-Scholes model have led to the overpricing of out of the money options. This is done in order to account for the excessive risk exposure associated with out of the money options.
The data recorded in a situation where out of the money or in the money options show a higher implied volatility than that of at the money options is known as a smile. It means that when the strike price of the options moves away from the current market price of that option, the implied volatility for the put options and call options increases.
Generally, the implied volatility of at the moneyAt The Money (ATM)At the money (ATM) describes a situation when the strike price of an option is equal to the underlying asset's current market price. It is a concept of options tends to remain low. Thus, the existence of a smile implied that a money manager would typically prefer writing call options over put options.
The Black-Scholes Model
Volatility smiles are not typical observations, and the Black-Scholes options theory is premised upon a volatility curve that is completely flat.
The Black-Scholes model is the standard formula that is used for pricing derivatives, especially options. When the implied volatility of options is plotted against the corresponding strike prices, the Black-Scholes model predicts that the curve obtained is flat. It means that all options set to expire on the same date and carrying an underlying asset that, as valued at the same price, have the same implied volatility.
However, it does not always hold true. Markets are often witnesses to extreme events, which tend to create inconsistencies in general trends in the market. A volatility smile recorded for the first time in financial history was in the aftermath of the Black Monday stock market crash of 1987Black Monday"Black Monday" – as it is referenced today – took place on October 19 (a Monday) in 1987. On this day, stock markets around the world crashed, though the.
When an extreme event occurs, it can cause a significant shift in the prices of options, which is why it needs to be factored into implied volatility. Thus, while creating financial modelsTypes of Financial ModelsThe most common types of financial models include: 3 statement model, DCF model, M&A model, LBO model, budget model. Discover the top 10 types, there is a need to factor in the possibility of occurrence of extreme events.
What are the Limitations of a Volatility Smile?
A volatility smile is only a model, and the implied volatility of options may not necessarily align with it. It can be that implied volatility is aligned with a reverse or forward skew rather than a smile. Usually, forex options and near-term equity options tend to align with volatility smiles. On the other hand, long-term equity options and index options lean more toward aligning with a skew.
A volatility smile may not always possess a clean U-shape. It can occur due to external market factors, such as demand and supply imbalances. Thus, an investor must multiple factors making trading decisions. A volatility smile is merely an indicator of which segment of the market is likely to see less price volatility.
Additional Resources
CFI is the official provider of the global Commercial Banking & Credit Analyst (CBCA)™Program Page - CBCAGet CFI's CBCA™ certification and become a Commercial Banking & Credit Analyst. Enroll and advance your career with our certification programs and courses. certification program, designed to help anyone become a world-class financial analyst. To keep advancing your career, the additional CFI resources below will be useful:
- Black TuesdayBlack TuesdayBlack Tuesday is the stock market crash that occurred on October 29, 1929. It is considered the most disastrous market crash in the history of the United States. The Black Tuesday event was preceded by the crash of the London Stock Exchange and Black Monday
- Stock ExchangeStock ExchangeA stock exchange is a marketplace where securities, such as stocks and bonds, are bought and sold. Stock exchanges allow companies to raise capital and investors to make informed decisions using real-time price information. Exchanges can be a physical location or an electronic trading platform.
- Volatility ArbitrageVolatility ArbitrageVolatility arbitrage refers to a type of statistical arbitrage strategy that is implemented in options trading. It generates profits from the difference
- Options: Calls and PutsOptions: Calls and PutsAn option is a derivative contract that gives the holder the right, but not the obligation, to buy or sell an asset by a certain date at a specified price.
-
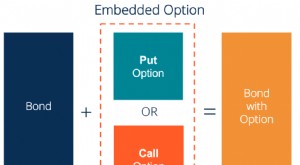
Embedded Options: Understanding Rights and Future Actions in Financial Securities
An embedded option is a provision in a financial security (typically in bondsBondsBonds are fixed-income securities that are issued by corporations and governments to raise capital. The bond issuer bo
-
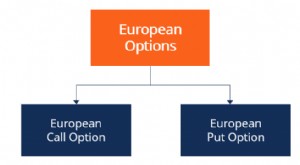
Understanding European Options: Definition & Key Features
A European option is a type of options contract where the buyer or seller is able to execute the option only at its expiration dateExpiration Date (Derivatives)The expiration date refers to the date i
invest
- Understanding Earnings Volatility: Risk & Stock Price Prediction
- Understanding Exotic Options: A Comprehensive Guide
- Understanding Options Expiration Time: Key Dates & Deadlines
- Understanding Historical Volatility (HV): A Comprehensive Guide
- Understanding Implied Volatility (IV): A Comprehensive Guide
- Understanding Index Options: A Comprehensive Guide
- Understanding Volatility: A Key Indicator of Investment Risk
- Volatility Ratio: Understanding Price Changes for Trading & Investing
- Understanding Volatility Skew: A Guide for Investors
-
 Understanding Early Exercise of Options Contracts
Early exercise refers specifically to options contracts. The early exercise of an options contract refers to the process of buying and/or selling shares of a particular stock that include the underlyi...
-
 Options Trading Explained: Risks & Rewards for Investors
When it comes to trading securities, you have a lot of choices. The market offers plenty of financial products to help you customize your investment strategy. While we typically advocate for passive i...