Momentum Investing: A Comprehensive Guide for Investors
Momentum investing is an investment strategyStock Investment StrategiesStock investment strategies pertain to the different types of stock investing. These strategies are namely value, growth and index investing. The strategy an investor chooses is affected by a number of factors, such as the investor’s financial situation, investing goals, and risk tolerance. aimed at purchasing securitiesMarketable SecuritiesMarketable securities are unrestricted short-term financial instruments that are issued either for equity securities or for debt securities of a publicly listed company. The issuing company creates these instruments for the express purpose of raising funds to further finance business activities and expansion. that have been showing an upward price trend or short-selling securities that have been showing a downward trend. The main rationale behind momentum investing is that once a trend is well-established, it likely to continue.

There is no consensus among economists and finance professionalsTop Finance CertificationsList of the top finance certifications. Get an overview of the best financial certifications for professionals around the world working in the finance industry regarding the validity of a momentum investing strategy. Economists try to explain the effects of momentum investing using the efficient-market theory.
One hypothesis states that investors bear a significant risk when implementing a momentum investing strategy. Potentially high returns are the reward that counterbalances that risk. Another hypothesis suggests that momentum investors are leveraging the behavioral weaknesses of other investors, such as the tendency to “follow the herd”, also known as the “herd mentality bias”.
Characteristics of Momentum Investing
Momentum investing is strictly a technical trading strategy. Unlike fundamental or value investors, momentum investors are not concerned with a company’s operational performance. Momentum investors apply technical indicators to the analysis of a security in order to identify trends and gauge the strength of the trend – in other words, to determine the level of price momentum in the market.
Momentum investors also seek to analyze, understand, and, if possible, anticipate the behavior of other investors in the market. Awareness of behavioral biases and investor emotions can significantly enhance the effectiveness of a momentum investing strategy.
Technical Analysis Tools in Momentum Trading
Technical analysis is the primary point of reference for momentum investors. Since traders spend a significant amount of time trying to determine the strength of trends in asset prices, knowledge of key technical indicators is crucial to the successful execution of a momentum trading strategy.
Following are some of the technical indicators that are most commonly used in momentum trading:
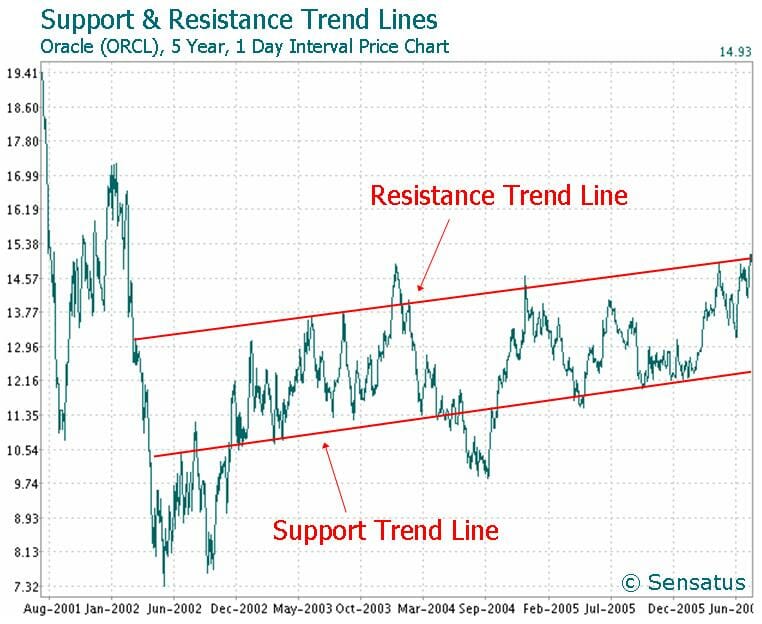
1. Trend lines
Trend lines are a basic technical analysis tool for monitoring price movements. A trend line is drawn between two successive points on a price chart. If the resulting line is sloping upward, then it indicates that there is a positive, bullish trend, and an investor may buy shares. If the resulting line is downsloping, then the trend is negative, or bearish, and selling short is indicated as the most likely profitable position to adopt.
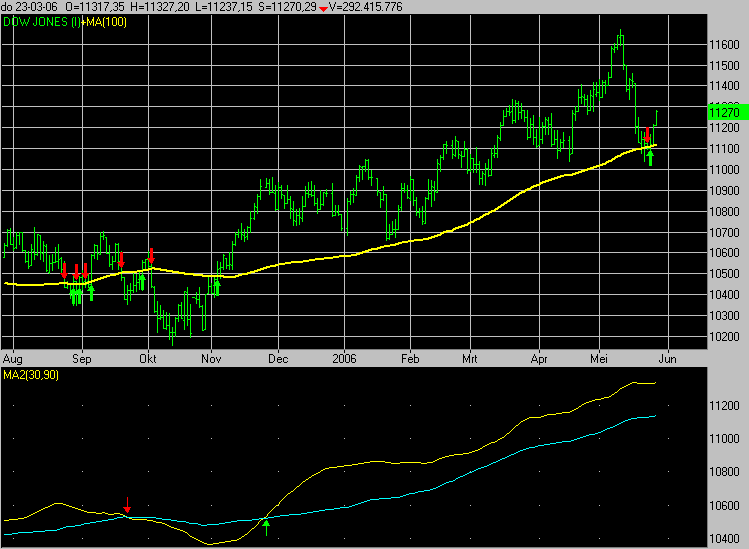
2. Moving averages
A moving average line enables traders to identify the prevailing trend while eliminating much of the market “noise” that comes from small, insignificant price fluctuations. When a security’s price consistently remains at or above a moving average, that indicates the existence of an uptrend. A downtrend is usually reflected on a chart by price maintaining a position at or below a chosen moving average.
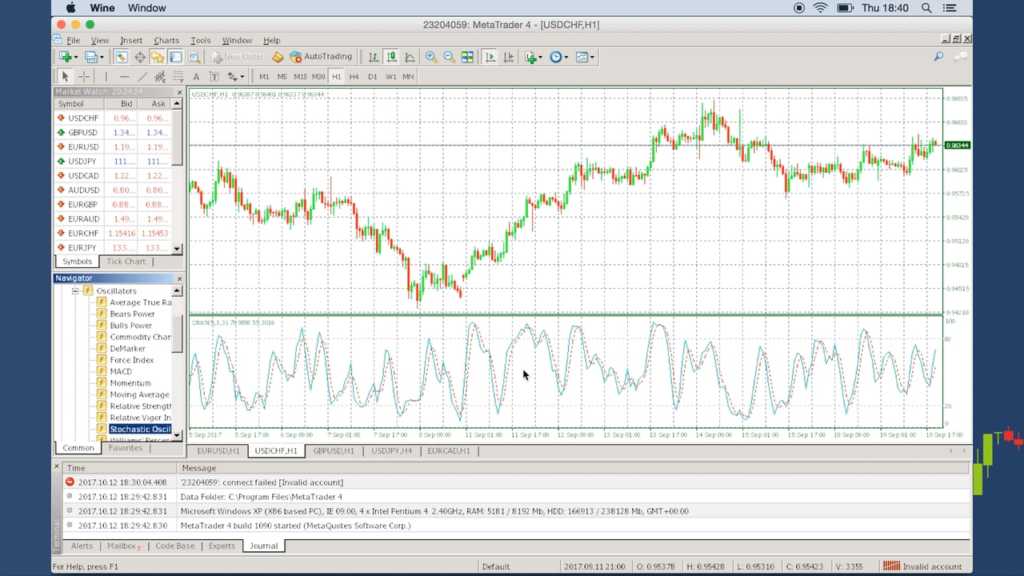
3. Stochastic oscillator
The stochastic oscillator compares an asset’s most recent closing price to the prices over a specified period of time. When the closing price is near the high of the price range for the time period, the trend is positive. When the closing price is near the low, this indicates a downward trend.
Stochastic oscillator values range from 0 to 100. Higher numbers above 50 indicate a strengthening uptrend. Lower numbers, below 50, indicate a downtrend that is gaining momentum. However, an oscillator reading below 20 indicates oversold conditions in a market that may lead to a market reversal to the upside. Likewise, readings above 80 indicate overbought conditions and the potential for a bearish reversal.
4. The Average Directional Index (ADX)
The Average Directional Index (ADX) is a very popular momentum indicator and one that is generally considered less prone to producing false signals than the stochastic oscillator. The ADX is used to determine (A) the existence of a trend and (B) the strength of a trend. It does this by calculating the expansion (or contraction) of a security’s price range over a specified time period.
ADX values range from 0 to 100. Values below 25 (some traders use 20 rather than 25) indicate a ranging, or directionless, market in which no clear trend exists. A reading above 25 indicates the existence of a trend, and higher readings beyond that level indicate a stronger trend. In other words, an ADX reading of 40 indicates a stronger trend than an ADX reading of 30.
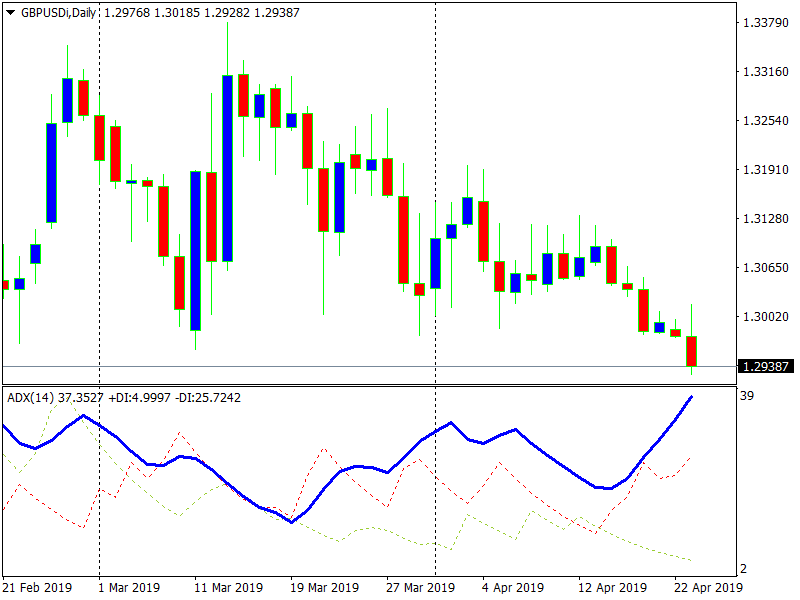
Traders also look for divergence between price movement and the ADX as a sign of waning or weakening momentum. If price makes a new high but the ADX does not reach a new high reading, that is bearish divergence of the ADX from price. On the other end of the scale, if price falls to a new low but the ADX does not see a new low reading, that represents a bullish divergence of the ADX from price.
Other popular momentum investing indicators include the Moving Average Convergence Divergence (MACD)MACD Oscillator - Technical AnalysisThe MACD Oscillator is used to examine short-term moving average convergence and divergence. The MACD Oscillator is a double-edged technical indicator in that it offers traders and analysts the ability to follow trends in the market, as well as gauge the momentum of price changes. indicator and the Relative Strength Index (RSI).
How Momentum Investing Works
Traders employing a momentum investing strategy look to profit from either buying or selling short securities when they are strongly trending – i.e., when price action momentum is high. High momentum is evidenced by price advancing or declining over a wide range in a relatively short period of time. Markets with high levels of momentum typically show increased volatility as well.
Momentum investing is typically short-term investing, as traders are merely looking to capture part of the price movement in a trend. A momentum investing trade unfolds as follows:
- A trader uses technical indicators such as trend lines, moving averages, and specific momentum indicators such as the ADX to identify the existence of a trend.
- As the trend gains momentum – strengthens – the trader takes a market position in the direction of the trend (buying an uptrend; selling a downtrend).
- When the momentum of the trend shows signs of weakening, such as a divergence between price action and the movement of momentum indicators such as the MACD or RSI, the trader looks to exit their position (hopefully at a profit), prior to any actual trend reversal.
More CFI Resources
We hope you’ve enjoyed reading CFI’s explanation of momentum investing. CFI is the global provider of the Financial Modeling & Valuation Analyst (FMVA)™Become a Certified Financial Modeling & Valuation Analyst (FMVA)®CFI's Financial Modeling and Valuation Analyst (FMVA)® certification will help you gain the confidence you need in your finance career. Enroll today! certification program, designed to teach anyone to become a world-class financial analyst. To learn more, check out the free resources below:
- Coattail InvestingCoattail InvestingCoattail investing refers to an investment strategy where an investor replicates the investment style of well-known successful investors. Individual investors use information published on the Securities Exchange Commission (SEC) to know the companies that a specific investor has invested in
- Long and Short PositionsLong and Short PositionsIn investing, long and short positions represent directional bets by investors that a security will either go up (when long) or down (when short). In the trading of assets, an investor can take two types of positions: long and short. An investor can either buy an asset (going long), or sell it (going short).
- Investing: A Beginner’s GuideInvesting: A Beginner's GuideCFI's Investing for Beginners guide will teach you the basics of investing and how to get started. Learn about different strategies and techniques for trading
- Trade Order TimingTrade Order Timing - TradingTrade order timing refers to the shelf-life of a specific trade order. The most common types of trade order timing are market orders, GTC orders,
-

Momentum Trading: A Comprehensive Guide to Riding Market Trends
Momentum trading is a type of trading strategy that seeks to capitalize on securities that are moving in a particular direction. This strategy utilizes the motto of the tren
-
Offshore Investing: Benefits, Risks & What You Need to Know
Offshore investing is a type of investment that has been around for many years. This type of investment can provide you with several benefits, but there are also a few drawbacks that you will wa
invest
- Coattail Investing: How to Follow Successful Investors
- Ethical Investing: Aligning Investments with Your Values
- Impact Investing: Generate Returns & Positive Change
- Income Investing: Generate Passive Income with Stocks & Bonds
- Index Investing: A Beginner's Guide to Passive Investing
- Understanding Momentum in Finance: A Comprehensive Guide
- Sustainable Investing: A Guide to ESG Strategies
- Value Investing: A Comprehensive Guide to Finding Undervalued Investments
- Investing Explained: A Comprehensive Guide for Beginners
-
 Understanding Short-Term Investments: A Comprehensive Guide
Short-term investments are assets that can be converted into cash or can be sold within a short period of time, typically within 1-3 years. Common instruments for short-term investing include short-te...
-
 Understanding Futures Contracts: A Guide for Investors
You can’t predict the future, but you can try to predict — or hedge against — how much certain elements will cost when they arrive. A futures contract obligates a buyer to take d...