Understanding Momentum Indicators in Trading
Momentum indicators are tools utilized by traders to get a better understanding of the speed or rate at which the price of a securityPublic SecuritiesPublic securities, or marketable securities, are investments that are openly or easily traded in a market. The securities are either equity or debt-based. changes. Momentum indicators are best used with other indicators and tools because they don’t work to identify the direction of movement, only the timeframe in which the price change is occurring.

Advantages of Momentum Indicators
Momentum indicators show the movement of price over time and how strong those movements are/will be, regardless of the direction the price moves, up, or down.
Momentum indicators are also specifically useful, as they help traders and analysts spot points where the market can and will reverse. The points are identified through divergence between price movement and momentum.
Because momentum indicators show the relative strength of price movements but leave out the directionality of the price movements, such indicators are best utilized in combination with other technical indicators – such as trend lines and moving averagesKaufman’s Adaptive Moving Average (KAMA)Kaufman’s Adaptive Moving Average (KAMA) was developed by American quantitative financial theorist, Perry J. Kaufman, in 1998. The technique began in 1972 but Kaufman officially presented it to the public through his book, "Trading Systems and Methods." Unlike other moving averages – which show price trends and directions.
Understanding Divergence
Divergence occurs when, for example, the price of a stock is continually moving downward, following along with the momentum indicator being used (which signals strong momentum), but then the momentum indicator turns to the upside or no longer continues to follow the downward price movement. It means that the indicator’s diverged from the price movement and indicates that the momentum of the current price movement is failing.
The chart below shows how the Relative Strength Index (RSI)Relative Strength Index (RSI)The Relative Strength Index (RSI) is one of the most popular and widely used momentum oscillators. It was originally developed by the famed mechanical engineer turned technical analyst, J. Welles Wilder. The RSI measures both the speed and rate of change in price momentum indicator reveals impending price direction changes as the movement of the RSI diverges from the direction of price movement in the AUD/USD currency pair.
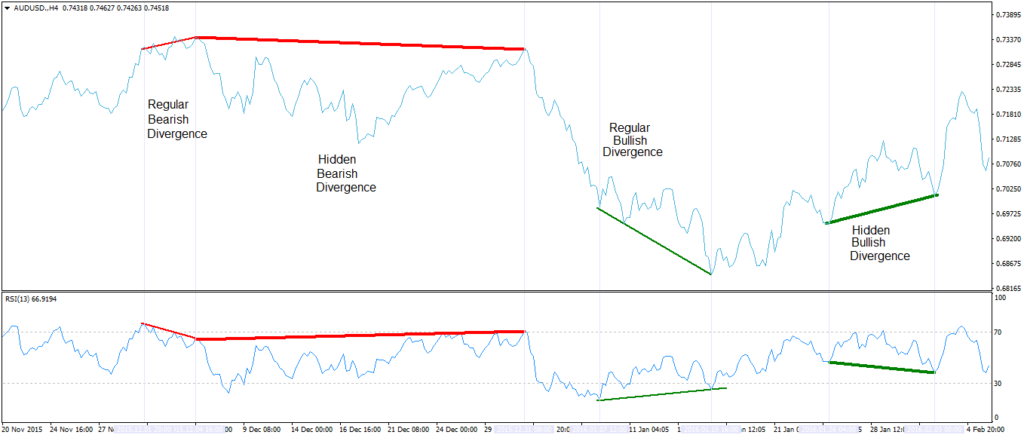
Divergence is typically an indication that the current price trend – due to the signal that momentum is stalling – is likely coming to an end and is about to reverse. When price movement and momentum diverge in an upward fashion, it is a bullishBullish and BearishProfessionals in corporate finance regularly refer to markets as being bullish and bearish based on positive or negative price movements. A bear market is typically considered to exist when there has been a price decline of 20% or more from the peak, and a bull market is considered to be a 20% recovery from a market bottom. divergence. If price movement and the momentum indicator were continually moving upward and the momentum indicator suddenly turned to the downside, it would be a bearish divergence.
Popular Momentum Indicators
There are a variety of momentum indicators that traders can utilize. However, there are a few that are very popular with traders and widely used.
1. Moving Average Convergence Divergence (MACD)
The Moving Average Convergence Divergence (MACD)MACD Oscillator - Technical AnalysisThe MACD Oscillator is used to examine short-term moving average convergence and divergence. The MACD Oscillator is a double-edged technical indicator in that it offers traders and analysts the ability to follow trends in the market, as well as gauge the momentum of price changes. is one of the most popular momentum indicators. The MACD uses two indicators – moving averages – turning them into an oscillator by taking the longer average out of the shorter average. It means that the MACD indicates momentum as it oscillates between moving averages as they converge, overlap, and move away from one another.
As mentioned above, the MACD makes use of two moving averages. While it is up to the discretion of the trader or analyst, the indicator typically uses the 12-day and 26-day exponential moving averages (EMAs), subtracting the 26-day from the 12-day. The result is the MACD line, which is then usually graphed with a 9-day EMA, acting as a signal line that can identify price movement turns.
The truly important aspect of the MACD is the histogram, which reveals the difference between the MACD line and the 9-day EMA. When the histogram is positive – over the zero-midpoint line but begins to fall towards the midline – it signals a weakening uptrend. On the flipside, when the histogram is negative, under the zero-midpoint line but begins to climb towards it, it signals the downtrend is weakening.
2. Relative Strength Index (RSI)
The Relative Strength Index (RSI) is another popular momentum indicator. Also an oscillator, the RSI acts as a metric for price changes and the speed at which they change. The indicator fluctuates back and forth between zero and 100. Signals can be spotted by traders and analysts if they look for divergences, failed swings of the oscillator, and when the indicator crosses over the centerline.
Any rising RSI values above 50 signal positive, uptrend momentum, though, if the RSI hits 70 or above, it’s often an indication of overbought conditions. Conversely, RSI readings that decrease below 50 show negative, downtrend momentum. If RSI readings are below 30, though, it is an indication of possible oversold conditions.
3. Average Directional Index (ADX)
Finally, the Average Directional Index (ADX)ADX Indicator - Technical AnalysisADX stands for average directional movement index. The ADX indicator is an indicator of trend strength, commonly used in futures trading. However, it has since been widely applied by technical analysts to virtually every other tradeable investment, from stocks to forex to ETFs. must be mentioned. In reality, creator Welles Wilder established the Directional Movement System – consisting of the ADX, the Minus Directional Indicator (-DI), and the Plus Directional Indicator (+DI) – as a group that could be used to help measure both the momentum and direction of price movements.
The ADX is derived from the smoothed averages of the -DI and +DI, which are themselves derived from the comparison of two consecutive lows and their respective highs. The index is the portion of the Directional Movement System that acts as a metric for the strength of a trend, regardless of its direction. It’s important to note that with the ADX, values of 20 or higher suggest the presence of a trend. For any reading lower than 20, the market is viewed as “directionless.”
Final Word
Momentum indicators are vital tools for traders and analysts; however, they are rarely used in isolation. It is more common to utilize them with other technical indicators that reveal the directions of trends. Once a direction’s been determined, momentum indicators are valuable because they indicate the strength of price movement trends and when they are coming to an end.
Additional Resources
CFI is the official provider of the global Financial Modeling & Valuation Analyst (FMVA)™Become a Certified Financial Modeling & Valuation Analyst (FMVA)®CFI's Financial Modeling and Valuation Analyst (FMVA)® certification will help you gain the confidence you need in your finance career. Enroll today! certification program, designed to help anyone become a world-class financial analyst. To keep advancing your career, the additional resources below will be useful:
- Momentum InvestingMomentum InvestingMomentum investing is an investment strategy aimed at purchasing securities that have been showing an upward price trend or short-selling securities that
- Pivot PointsPivot PointsPivot points refer to technical indicators used by day traders to identify potential support and resistance levels in a securities market.
- Speed Lines – Technical AnalysisSpeed Lines - Technical AnalysisSpeed lines are an analysis tool used to determine support and resistance levels. They are not intended to be used as a standalone technical indicator.
- Technical Analysis – A Beginner’s GuideTechnical Analysis - A Beginner's GuideTechnical analysis is a form of investment valuation that analyses past prices to predict future price action. Technical analysts believe that the collective actions of all the participants in the market accurately reflect all relevant information, and therefore, continually assign a fair market value to securities.
-

Understanding Brent Crude Oil Prices: History & Market Factors
Brent crude oil took 10 years to climb from its record low to an all-time high, a level it has long since given up. A light, sweet crude oil that is traded on the Intercontinental Exchange and extract
-
Key Performance Indicators (KPIs): Definition, Examples & Importance
Key Performance Indicators (KPIs) are metrics used to periodically track and evaluate the performance of a businessCorporationA corporation is a legal entity created by individuals, stockholders, or s
invest
- Understanding Price Indices: A Comprehensive Guide
- Understanding Algorithms: A Guide to Algorithmic Trading
- Understanding Candlestick Patterns: A Comprehensive Guide
- Directional Trading Strategies: A Comprehensive Guide
- Donchian Channels: A Comprehensive Guide for Traders
- Understanding Equity Derivatives: A Comprehensive Guide
- Understanding Momentum Indicators in Trading
- Understanding Option Greeks: A Comprehensive Guide
- Technical Analysis: Understanding Speed Lines and Forecasting Market Trends
-
 Understanding Strangle Options: A Comprehensive Guide
Strangle is an investment methodInvestment MethodsThis guide and overview of investment methods outlines they main ways investors try to make money and manage risk in capital markets. An investment is...
-
 Understanding Volatility: A Key Indicator of Investment Risk
Volatility is a measure of the rate of fluctuations in the price of a securityMarketable SecuritiesMarketable securities are unrestricted short-term financial instruments that are issued eit...