Swing Trading Explained: A Beginner's Guide to Profiting from Trends
Swing trading is a trading technique that traders use to buy and sell stocks when indicators point to an upward (positive) or downward (negative) trend in the future, which can range from overnight to a few weeks. Swing trades aim to capitalize on buying and selling the interim lows and highs within a larger overall trend.
Traders use technical indicatorsTechnical Analysis - A Beginner's GuideTechnical analysis is a form of investment valuation that analyses past prices to predict future price action. Technical analysts believe that the collective actions of all the participants in the market accurately reflect all relevant information, and therefore, continually assign a fair market value to securities. to determine if specific stocksCommon StockCommon stock is a type of security that represents ownership of equity in a company. There are other terms – such as common share, ordinary share, or voting share – that are equivalent to common stock. possess momentum and the best time to buy or sell. To exploit the opportunities, the traders must act quickly to increase their chances of making a profitGross ProfitGross profit is the direct profit left over after deducting the cost of goods sold, or cost of sales, from sales revenue. It's used to calculate the gross profit margin. in the short-term.
How Swing Trades Works
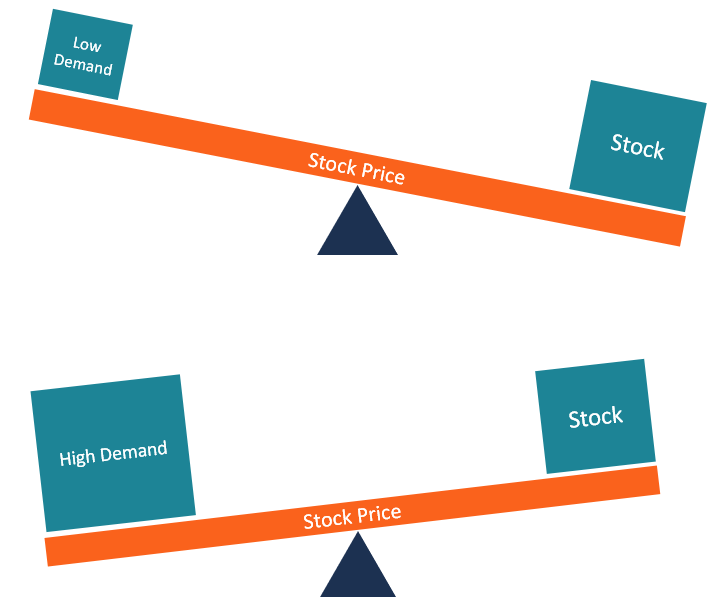
Swing trading seeks to capitalize on the upward and downward “swings” in the price of a security. Traders hope to capture small moves within a larger overall trend. Swing traders aim to make a lot of small wins that add up to significant returns. For example, other traders may wait five months to earn a 25% profit, while swing traders may earn 5% gains weekly and exceed the other trader’s gains in the long run.
Most swing traders use daily chartsHow to Read Stock ChartsIf you’re going to actively trade stocks as a stock market investor, then you need to know how to read stock charts. Even traders who primarily use fundamental analysis to select stocks to invest in still often use technical analysis of stock price movement to determine specific buy and sell, stock charting (like 60 minutes, 24 hours, 48 hours, etc.) to choose the best entry or exit point. However, some may use shorter time frame charts, such as 4-hour or hourly charts.
Swing Trades vs. Day Trading
Swing trading and day trading appear similar in some respects. The main factor differentiating the two techniques is the holding position time. While swing traders may hold stocks overnight to several weeks, day trades close within minutes or before the close of the market.
Day traders do not hold their positions overnight. It often means they avoid subjecting their positions to risksSystemic RiskSystemic risk can be defined as the risk associated with the collapse or failure of a company, industry, financial institution or an entire economy. It is the risk of a major failure of a financial system, whereby a crisis occurs when providers of capital lose trust in the users of capital resulting from news announcements. Their more frequent trading results in higher transaction costs, which can substantially decrease their profits. They often trade with leverage in order to maximize profits from small price changes.
Swing traders are subjected to the unpredictability of overnight risks that may result in significant price movements. Swing traders can check their positions periodically and take action when critical points are reached. Unlike day trading, swing trading does not require constant monitoring since the trades last for several days or weeks.
Trading Strategies
Swing traders can use the following strategies to look for actionable trading opportunities:
1. Fibonacci retracement
Traders can use a FibonacciFibonacci NumbersFibonacci Numbers are the numbers found in an integer sequence discovered/created by mathematician, Leonardo Fibonacci. The sequence is a series of numbers retracement indicator to identify support and resistance levels. Based on this indicator, they can find market reversal opportunities. The Fibonacci retracement levels of 61.8%, 38.2%, and 23.6% are believed to reveal possible reversal levels. A trader might enter a buy trade when the price is in a downward trend and seems to find support at the 61.8% retracement level from its previous high.
2. T-line trading
Traders use the T-line on a chart to make a decision on the best time to enter or exit a trade. When a security closes above the T-line, it is an indication that the price will continue to rise. When the security closes below the T-line, it is an indication that the price will continue to fall.
3. Japanese candlesticks
Most traders prefer using the Japanese candlestick charts since they are easier to understand and interpret. Traders use specific candlestick patterns to identify trading opportunities.
Additional Resources
Thank you for reading CFI’s explanation of swing trading. CFI offers the Capital Markets & Securities Analyst (CMSA)®Program Page - CMSAEnroll in CFI's CMSA® program and become a certified Capital Markets &Securities Analyst. Advance your career with our certification programs and courses. certification program for those looking to take their careers to the next level. To keep learning and advancing your career, the following resources will be helpful:
- Long and Short PositionsLong and Short PositionsIn investing, long and short positions represent directional bets by investors that a security will either go up (when long) or down (when short). In the trading of assets, an investor can take two types of positions: long and short. An investor can either buy an asset (going long), or sell it (going short).
- Momentum InvestingMomentum InvestingMomentum investing is an investment strategy aimed at purchasing securities that have been showing an upward price trend or short-selling securities that
- Trade Order TimingTrade Order Timing - TradingTrade order timing refers to the shelf-life of a specific trade order. The most common types of trade order timing are market orders, GTC orders,
- Investing: A Beginner’s GuideInvesting: A Beginner's GuideCFI's Investing for Beginners guide will teach you the basics of investing and how to get started. Learn about different strategies and techniques for trading
-
After Hours Trading Explained: A Comprehensive Guide
After hours trading refers to the time outside regular trading hours when an investor can buy and sell securities. The main exchanges in the United States, NASDAQ and NYSENew York Stock Exchange (NYSE
-

Understanding After-Hours Trading: Opportunities & Strategies
Many people are accountable to a daily routine, generally based on regular business hours. When the workday is done, many of them turn off their working mindset until the next workday starts. It’s
invest
- CFD Trading Explained: A Comprehensive Guide for Investors
- Day Trading Explained: Strategies, Risks & How It Works
- Proprietary Trading: A Comprehensive Guide for Investors
- Quantitative Trading: A Deep Dive into Models & Analysis
- Spread Trading: A Comprehensive Guide to Relative Value Trading
- The Trader's Mindset: Key to Successful Trading
- Trading Accounts: Your Gateway to Investing & Trading
- Understanding Trading Floors: A Comprehensive Guide
- Swing Trading: A Beginner's Guide to Short-Term Stock Profits
-
 Day Trading Explained: A Beginner's Guide to Short-Term Stock Trading
Day trading is a type of trading in which a security is only held for a short amount of time. Traders will buy a stock and then sell it again within the same day instead of holding it for the lo...
-
Kraken: A Comprehensive Guide to Cryptocurrency Trading
Cryptocurrencies have become increasingly popular with investors, traders, and other market participants across the globe. Along with a significant surge in the launch of numerous virtual currencies...