Quantitative Trading: A Deep Dive into Models & Analysis
Quantitative trading is a type of trading that uses quantitative analysisQuantitative AnalysisQuantitative analysis is the process of collecting and evaluating measurable and verifiable data to understand the behavior and performance of a business. and mathematical models to analyze the change in price and volume of securities in the stock market. Mathematical models and computations are used to collect and analyze data with a rapid throughput rate on investment opportunities.
Quantitative trading is employed by hedge fundsHedge FundA hedge fund, an alternative investment vehicle, is a partnership where investors (accredited investors or institutional investors) pool and financial institutions, as their transactions are large and may involve the buying and selling of thousands of securities and shares. However, in recent years, more individual investors are turning to quantitative trading. Investors who use quantitative trading utilize programming languages to conduct web scraping (harvesting) to extract historical data on the stock market. The historical data is used as an input for mathematical models in a process called beta-testing of quantitative models.
An investor will wait to implement models into the real world that are undergoing beta testing and will only implement the mathematical model if the results from the beta testing are positive. A real-life example of quantitative trading is when an investor predicts that the value of Amazon stock will increase by 95% year-to-date, while the stock is at an all-time low.
The investor derives the assumption by collecting, reviewing, and analyzing historical data and feeding it into the mathematical model. Every data set reveals patterns, and quantitative trading extracts patterns from the dataset. The investor can review the patterns and compare them to historical data in a process called backtestingBacktestingBacktesting involves applying a strategy or predictive model to historical data to determine its accuracy. It can be used to test and compare the viability.
Summary
- Quantitative trading is a type of trading that uses quantitative analysis and mathematical models to analyze the change in price and volume of a security in the stock market.
- Investors that use quantitative trading utilize programming languages to conduct web scraping to extract historical data on the stock market. The historical data is used as an input for mathematical models in a process called beta-testing of quantitative models.
- The two most important components of quantitative trading are price and volume, and quantitative techniques include statistical arbitrage, algorithmic trading, and high-frequency trading.
Basic Components of Quantitative Trading
The two most important components of quantitative trading are price and volume, and quantitative techniques include statistical arbitrage, algorithmic tradingAlgorithmic TradingAlgorithmic trading strategies involve making trading decisions based on pre-set rules that are programmed into a computer., and high-frequency trading. The techniques are quick and typically employ short-term investment horizons.
Quantitative traders use quantitative tools, such as oscillators and moving averages, to create their own quantitative trading systems. There are other modern technologies, mathematics, and the availability of comprehensive databases that quantitative traders use to make rational trading decisions.
Quantitative Trading System
Every quantitative trading system consists of four important components, such as:
1. Strategy Identification
The initial stage of the quantitative trading process begins with the research process that involves identifying a trading strategy and identifying whether the strategy is in line with other strategies employed by the trader.
2. Strategy Backtesting
The goal of strategy backtesting is to understand whether the strategy identified in the first step is profitable when applied to historical and out-of-sample data. It is done to get an expectation of how the strategy will perform in the real world; however, positive backtesting results will not guarantee success.
3. Execution System
The execution system is the process through which a list of trades is generated by the strategy and executed by a broker. The execution system can be automated or semi-automated. The key consideration when creating an execution system is the interface to the brokerage, reduced transaction costs, and divergence of performance of the live system from the backtested performance.
4. Risk Management
Various risks are related to quantitative trading, including technology risks, brokerage risks, etc.
Advantages of Quantitative Trading
An experienced trader not using quantitative trading systems can successfully make trading decisions on a specialized number of shares before the quantity of incoming data overwhelms the decision-making process. The use of quantitative trading techniques automates tasks that were manually completed by investors.
Emotion is another important aspect that hinders the ability of traders. It can either be greed or fear when trading. Emotions serve only to choke rational thinking, which generally leads to losses. Mathematical models and computers do not encounter such a problem, so quantitative trading eliminates the problem of “emotion-based trading.”
Disadvantages of Quantitative Trading
Financial markets are very dynamic, and quantitative trading models must be dynamic to operate in such an environment successfully. Ultimately, many quantitative traders fail to keep with the changes in market conditions because they develop models that are temporarily profitable for the current market condition.
Additional Resources
CFI is the official provider of the Capital Markets & Securities Analyst (CMSA)®Program Page - CMSAEnroll in CFI's CMSA® program and become a certified Capital Markets &Securities Analyst. Advance your career with our certification programs and courses. certification program, designed to transform anyone into a world-class financial analyst.
To keep learning and developing your knowledge of financial analysis, we highly recommend the additional resources below:
- How to Scrape Stock Data with Python?How to Scrape Stock Data with PythonFinancial professionals looking to upgrade their skills can do so by learning how to scrape stock data with the Python programming language.
- MACD OscillatorMACD Oscillator - Technical AnalysisThe MACD Oscillator is used to examine short-term moving average convergence and divergence. The MACD Oscillator is a double-edged technical indicator in that it offers traders and analysts the ability to follow trends in the market, as well as gauge the momentum of price changes.
- Moving AverageMoving AverageA moving average is a technical indicator that market analysts and investors may use to determine the direction of a trend. It sums up the data points
- Technical IndicatorTechnical IndicatorA technical indicator is a mathematical pattern derived from historical data used by technical traders or investors to predict future price
-

Understanding Commodities: A Beginner's Guide to Investing
Commodities are another class of assets just like stocks and bondsBondsBonds are fixed-income securities that are issued by corporations and governments to raise capital. The bond issuer borrows capit
-
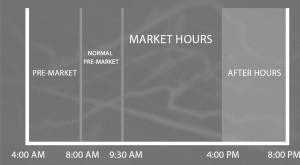
Extended Trading Hours: A Comprehensive Guide for Investors
Extended trading (or electronic trading hours) is trading conducted by electronic networks either before or after the trading day of a stock exchange, i.e., pre-market trading or after-hours tradingAf
invest
- CFD Trading Explained: A Comprehensive Guide for Investors
- Day Trading Explained: Strategies, Risks & How It Works
- Proprietary Trading: A Comprehensive Guide for Investors
- Spread Trading: A Comprehensive Guide to Relative Value Trading
- Trading Authorization: Empowering Your Broker & Account Security
- Trading Channels: Understanding Uptrends & Downtrends
- Trading Plan: A Comprehensive Guide to Successful Trading
- Understanding Trading Sessions: Hours & Global Markets
- Trading Software: A Comprehensive Guide for Traders
-
 Basis Trading: Definition, Strategy & How It Works
Basis trading is a financial arbitrage trading strategy that involves the trading of a financial instrument, such as a financial derivative or a commodityCommoditiesCommodities are another class of as...
-
 Circuit Breakers: Understanding Trading Halts & Market Stability
A circuit breaker is a regulatory instrument that halts the trading of a securityStockWhat is a stock? An individual who owns stock in a company is called a shareholder and is eligible to claim part o...