Relative Strength Index (RSI): A Comprehensive Guide for Traders
The Relative Strength Index (RSI) of a security or commodity attempts to measure its momentum. Namely, the formula is used to estimate whether the stock has been overbought or oversold, which could falsely affect price even if the underlying asset has held relatively constant. The RSI was developed by J. Welles Wilder in an article for Commodities magazine in 1978. It is a simple technical formula that uses a scale of 0 to 100 to indicate the momentum of the security.
Formula for RSI
The formula for RSI is simple:
RSI = 100 - (100/relative strength)
In this case, relative strength (RS) is a ratio of the average of the up closes over down closes over a certain period of time. For example, if an analyst wanted to measure the RS of Stock A over 30 days, they would take the average up closes of a 30 day period over the average down closes over the same period. Once the RS is found, it is factored into 100, and subtracted from 100. The result is a number from 0 to 100. A security is considered to be overbought when the RSI is above 70, and oversold when the RSI is below 30.
RSI Example
Stock A has been purchased and sold over a 10-day period. Over those 10 days, the prices have been as follows:
$3, 4, 6, 3, 2, 4, 4, 3, 5, 5
- First, calculate the average gain on up closes: (1 + 2 + 2 + 2) / 4 = 1.75
- Next, calculate the average loss on down closes: (3 + 1 + 1 ) / 3 = 1.67
- Now, calculate RS: 1.75/1.67 = 1.05
- Finally, calculate RSI: 100 - (100/1.05) = 4.76
The security has been oversold.
Using RSI to Pick Securities
When a security has been oversold, the market has been flooded with sell orders. This can falsely decrease the price even if the value of the asset is still strong. An oversold asset is a "value" asset. Once the market corrects for this over-selling, the price of the security is likely to rise again. This security is likely to outperform its competitors.
If a security has been overbought, it may be valued higher than what other factors would indicate is a "fair" price. The stocks of well-known, large, growth companies are often overbought. Even though they may present some dividend payments, the likelihood for large capital gains is reduced because the price is already very high. As a result, it is wise to avoid overbought stocks.
Limitations of RSI
RSI is a relatively limited factor for estimating the market momentum of a security. It can be easily thrown off if the price of a security experiences a very large surge or drop in price, even if this change is extremely temporary. As a result, it is best used in combination with other market indicators. Ask your broker about the RSI of a particular security for insight into its popularity, but be sure to consider the value of the underlying asset instead of picking a stock based on RSI alone.
-

Nikkei Index: Understanding Japan's Top Stock Market Indicator
The Nikkei Index, also commonly referred to as the Nikkei 225, is the most recognized Japanese stock market index. It comprises Japan’s top 225 companies that are listed on the Tokyo Stock
-

Price-Weighted Index Explained: How It Works & Examples
A price-weighted index is a type of stock market index in which each component of the index is weighted according to its current share price. In price-weighted indices, companies with a high share pri
Stock basis
- Relative Strength Investing: A Guide to Identifying Top Performers
- Relative Strength Index (RSI): A Comprehensive Guide to Trading
- Relative Strength Index (RSI): A Guide to Identifying Overbought/Oversold Stocks
- RSI vs. Stochastic Oscillator: A Comparative Analysis
- Kairi Relative Index (KRI): Definition & Technical Analysis
- Relative Strength Index (RSI): A Comprehensive Guide
- Understanding Conversion Ratios: A Simple Guide
- Understanding the Income Statement: A Guide for Investors
- Russell 3000 Index: Understanding the US Stock Market Leader
-
 Index Funds: A Comprehensive Guide for Investors
Index funds provide investors with a return that is directly linked to individual markets, while charging minimal amounts for expenses. Despite their benefits and growing popularity, not everyone kn...
-
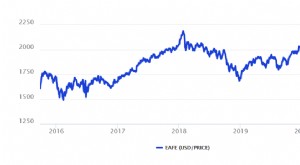 EAFE Index: Understanding Developed Market Performance
The EAFE Index (Europe, Australasia, and the Far East) was created to measure the performance of the stock markets in developed markets – excluding the U.S. and Canada. The indicator is maintain...